Research from Google found that website bounce rates increase by as much as 31% from one-second to three-second load times.
In my experience, page load times are one of the most consistent technical errors web developers and web admins make, especially over mobile devices.
The first step to resolving page speed errors is understanding how websites load and identifying the most critical metrics, which lead to faster load times.
Understanding Page Speed: How Websites Load
The internet is very complicated.
So to simplify this explanation, we can break down the page load process into two essential components, which communicate with one another.
Clients <> Servers
- Clients: A web device that sends a request over the internet to a server to render a webpage. Examples of clients include computer devices connected to WiFi, mobile devices connected to data plans, and browsers used to execute this function.
- Servers: A computer that stores web addresses and attempts to render requests so clients can view a webpage. Servers may also be called the DNS (domain name system), which houses every address available over the internet.
Understanding the relationship between clients and servers will help you uncover any potential disruptions or increases in latency that plague your website page speed.
As everyone knows, the first step to loading a webpage is typing in the URL. This URL sends a request to a DNS, which fetches the unique IP address and processes the request on the web application’s server.
Once the request is processed, the user’s browser will send an HTML response to begin processing the Document Object Model (DOM). The time to receive this information is known as the time to first byte (TTFB) – a vital page load metric.
Once the browser processes the HTML response, it will map out the DOM and CSS Object Model to execute JavaScript.
Before accurate rendering of a page can begin, a browser needs to render all CSS and JavaScript elements, which means that if there are any external blocking scripts, that resource will need to be downloaded.
Then, another request between the browser and server must be made (increasing load times).
Once complete, a window load event will be triggered, and the page will fully load above the fold.
Also, note that pages with asynchronous loading will continue loading elements even after window load events are executed.
However, page load times will differ between desktop and mobile devices, depending on the mobile-friendliness of the website and the network the device uses to connect to the internet.
For example, Google establishes its benchmark for mobile page speeds to load by at least one second for all above-the-fold content so that users can interact with sites as soon as possible.
Since network latency over a 4G network will consume at least 300 milliseconds of page load times, you have 700 milliseconds to optimize a page to load above-the-fold content in at least one second.
 Screenshot from developers.google.com, March 2023
Reaching this benchmark is possible but difficult.
So, why does Google recommend that pages load at least one second above the fold?
The Importance Of Website Speed
Since Google relies on positive customer experience to retain its market share, it only wants to serve sites that load quickly and efficiently.
As a result, it tends to prioritize pages that load faster than others. Furthermore, your analytics will tend to reflect this, as slower pages will incur higher bounce rates than faster pages.
Overall, there are several reasons why monitoring your page speed is essential:
- User Experience: Users expect fast-loading pages over mobile and desktop devices. The slower your page, the more time it takes until the first interaction and the higher your bounce rate. Not only does this impact key user metrics, but it could also decrease your conversion rate and might impact your website revenue.
- Google Algorithms: Research shows that Google places significance on page speed in its rankings algorithms, especially on mobile. How much this impacts rankings is unknown, but Google has stated that it prioritizes factors, such as its Core Web Vitals (metrics listed below).
- Functionality and Processing: Page speed is another important component of website functionality and can impede basic processes, such as loading shopping carts or blog posts, which cause high bounce rates.
- Authority and Trust: A fast-loading website communicates some level of trust and authority, whereas having a slow-loading website could communicate that your website is poorly built or even spammy.
With these factors in mind, you won’t be able to optimize your website’s page speed without uncovering issues that negatively influence it.
Furthermore, you’ll discover that page speeds differ across devices and locations, making the need for constant testing even more important.
Considerations When Running A Webpage Test
Not every page speed test or tool will deliver the same results.
For this reason, balancing these results and understanding what metrics to look after will give you the most unbiased results.
Caching
First and foremost, I would recommend testing sites with caching enabled and disabled to see the difference.
Most tools will typically ignore caching, but other tools like WordPress allow you to test page speeds with caching enabled.
Configure your caching to see if it interferes with your results or skews them from what you find on other tools.
Location
Many people don’t account for location when testing page speeds, but people in different countries and regions will experience different load times depending on their network and server proximity.
I’ve even seen people reduce their website load times substantially by hosting their site on a geographically closer server or enabling a content delivery network (CDN) – a network of distributed servers.
Running Multiple Tests
As you will experience, each page speed test may deliver different results depending on anomalies with your website or network.
For this reason, I recommend running multiple tests on multiple tools for the most accurate results of what users are experiencing.
Metrics
Finally, we must understand the metrics most important to our page load speeds.
Below, I’ve outlined a few that will influence page load speeds the most.
Page Load Time
This metric accounts for the total time it takes to load a page completely.
Google Analytics provides a page load time report for each of your URLs and even across different browsers.
 Screenshot from Google Analytics, March 2023
Time To First Byte (TTFB)
This measures the time it takes for browsers to receive an HTML request from a server.
Poor TTFB scores could indicate that you have many large files on your website or need to move to a new server.
Number Of HTTP Requests
Every time your page needs to load a file, it sends a new request that could serve as a drain on page speeds.
Core Web Vitals
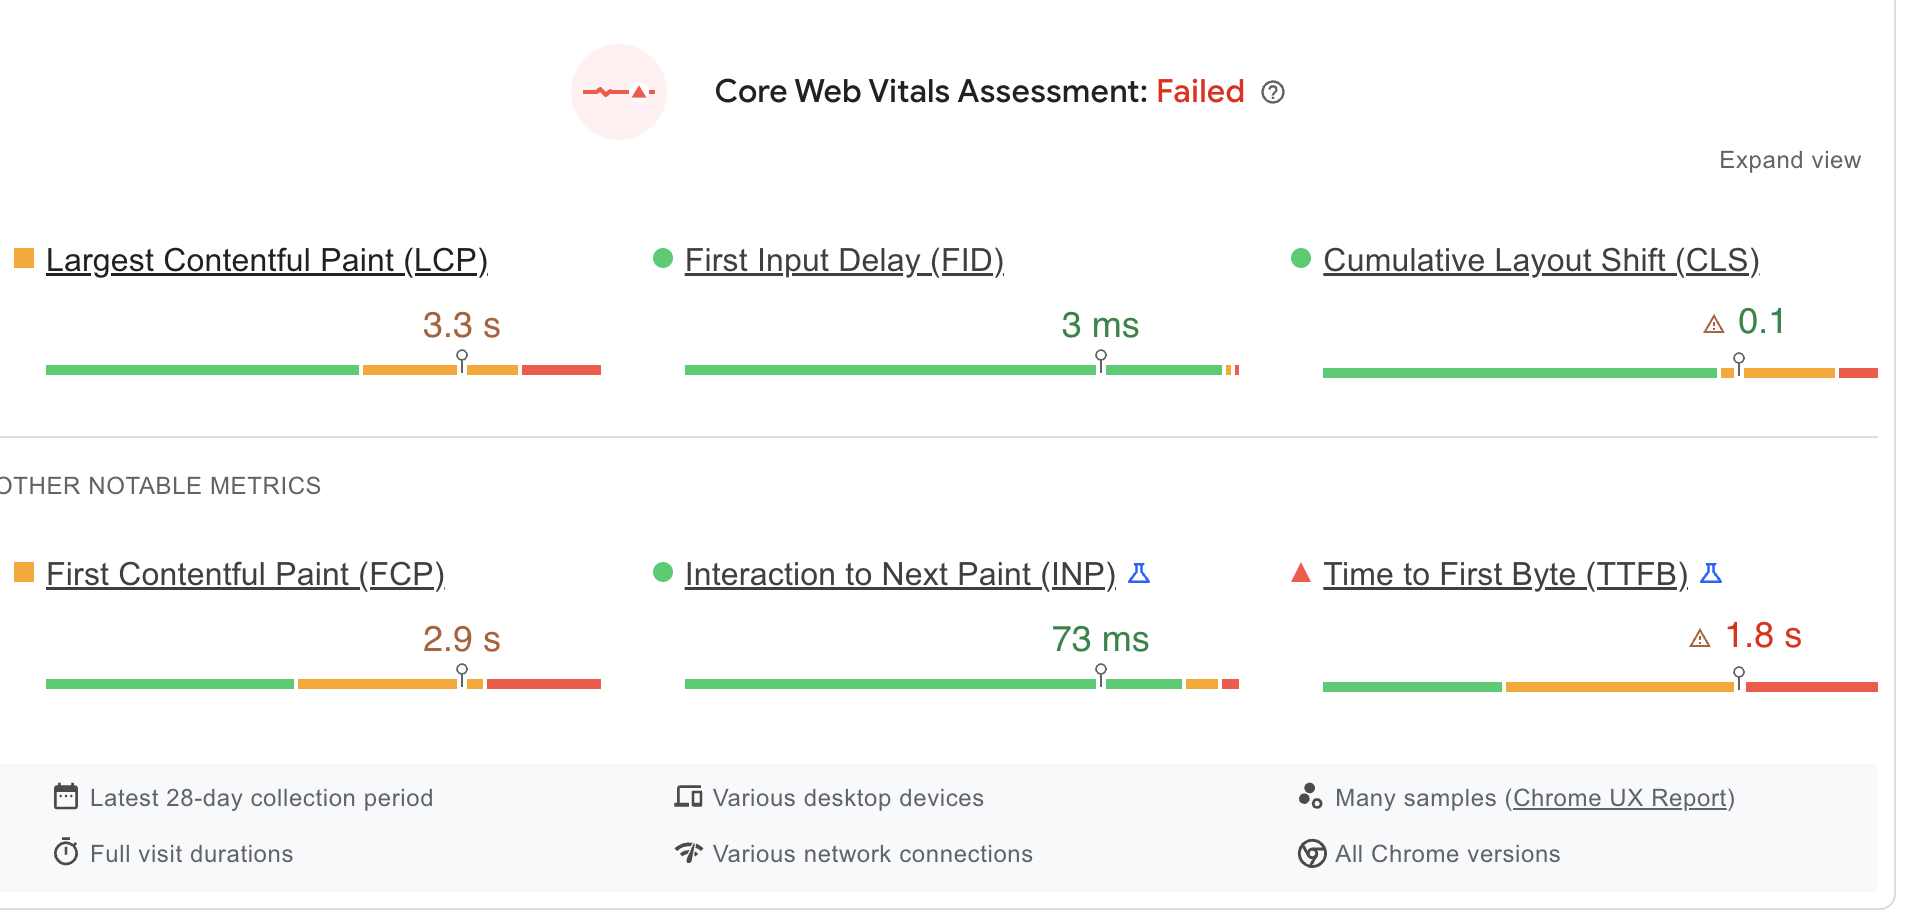 Screenshot from PageSpeed Insights, March 2023
- Largest Contentful Paint: The time it takes to load the largest image or text element on a page. This metric measures how fast the actual loadout of your page renders visually.
- First Input Delay: The time it takes for a user to interact with a page (i.e., click a link or scroll).
- Cumulative Layout Shift: How stable your page is. In other words, it measures whether page elements shift once the page is loaded.
Field Vs. Lab Data
Finally, when measuring page speeds, it’s essential to differentiate between field and lab data.
Field data takes into account the historical load time of a page, whereas lab data provides data from a simulated test.
Google Analytics provides field data and a historical record of how long it takes, on average, to load pages on your site.
On the other hand, lab data, like Google’s Lighthouse, provides an approximate measurement of page load speeds under set variables.
Lab data is great for diagnosing specific issues, while field data is an excellent way to chart the progress and usability of your website over time.
With these tips in mind, let’s explore some of the best tools I recommend every site should try out to test its website speeds.
Best Tools To Test Website Speed
Google PageSpeed Insights
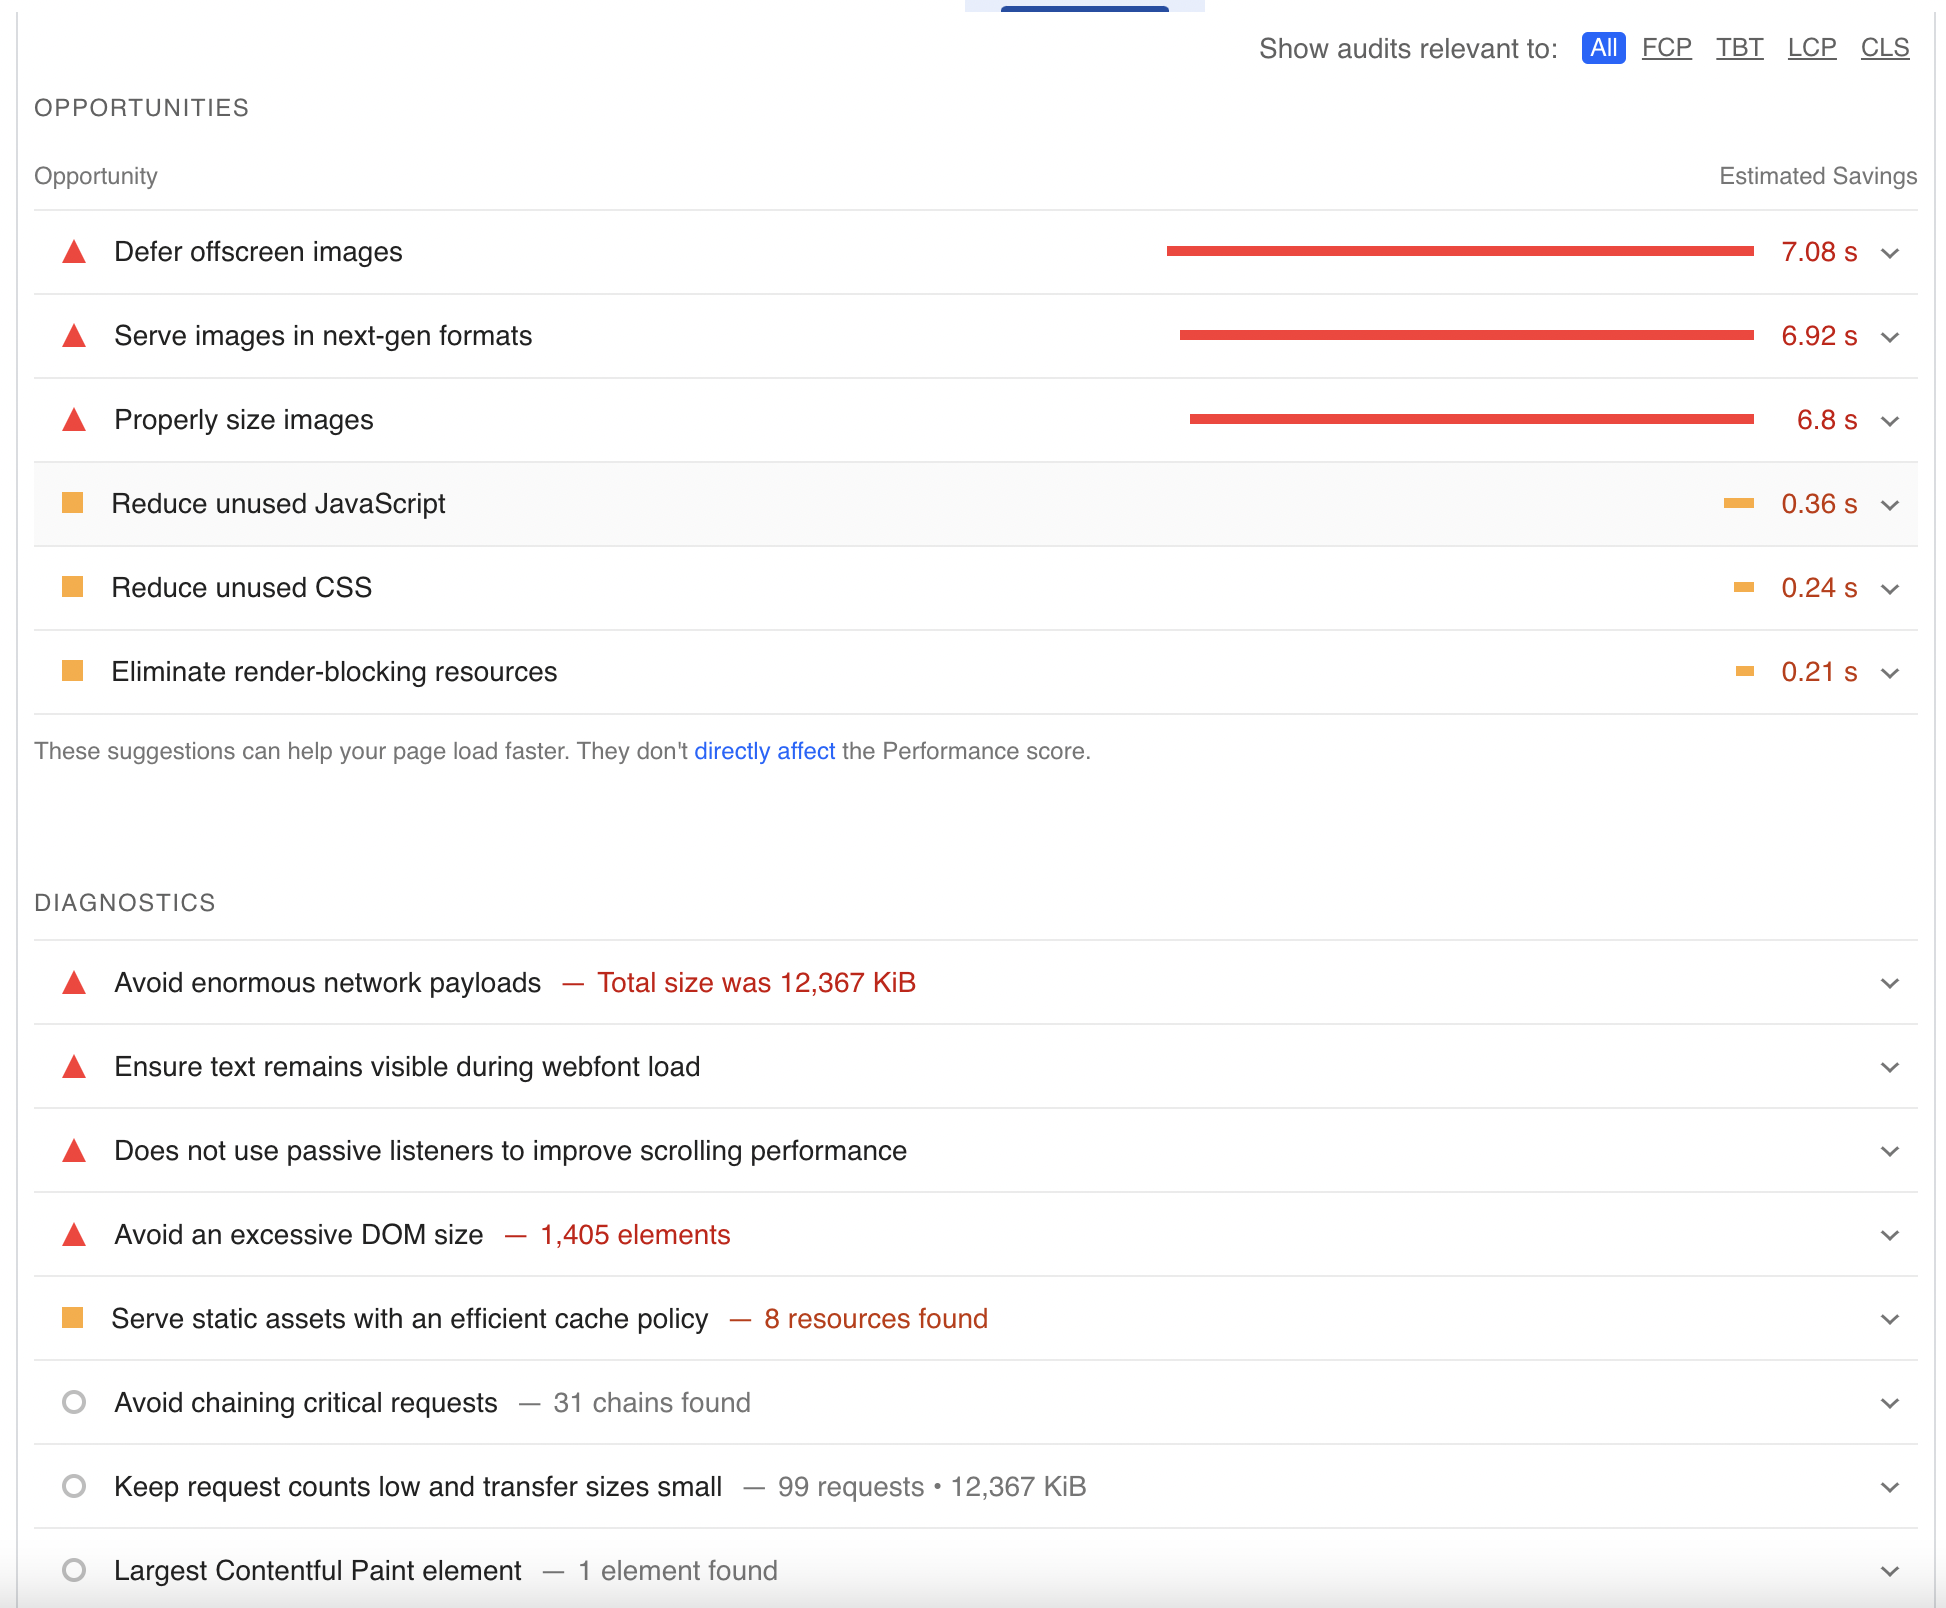
Google PageSpeed Insights is a free tool designed to diagnose specific opportunities where page speed is lacking.
 Screenshot from PageSpeed Insights, March 2023
These suggestions will boost your page speed scores and increase your keyword rankings.
This tool also provides metrics for Core Web Vitals, time to interactivity, and its general speed index.
PageSpeed Insights uses Lighthouse, which provides lab data to estimate how pages load on a standard device with a good WiFi connection.
PageSpeed Insights is a useful first step for uncovering surface-level issues that can be easily resolved.
GTMetrix
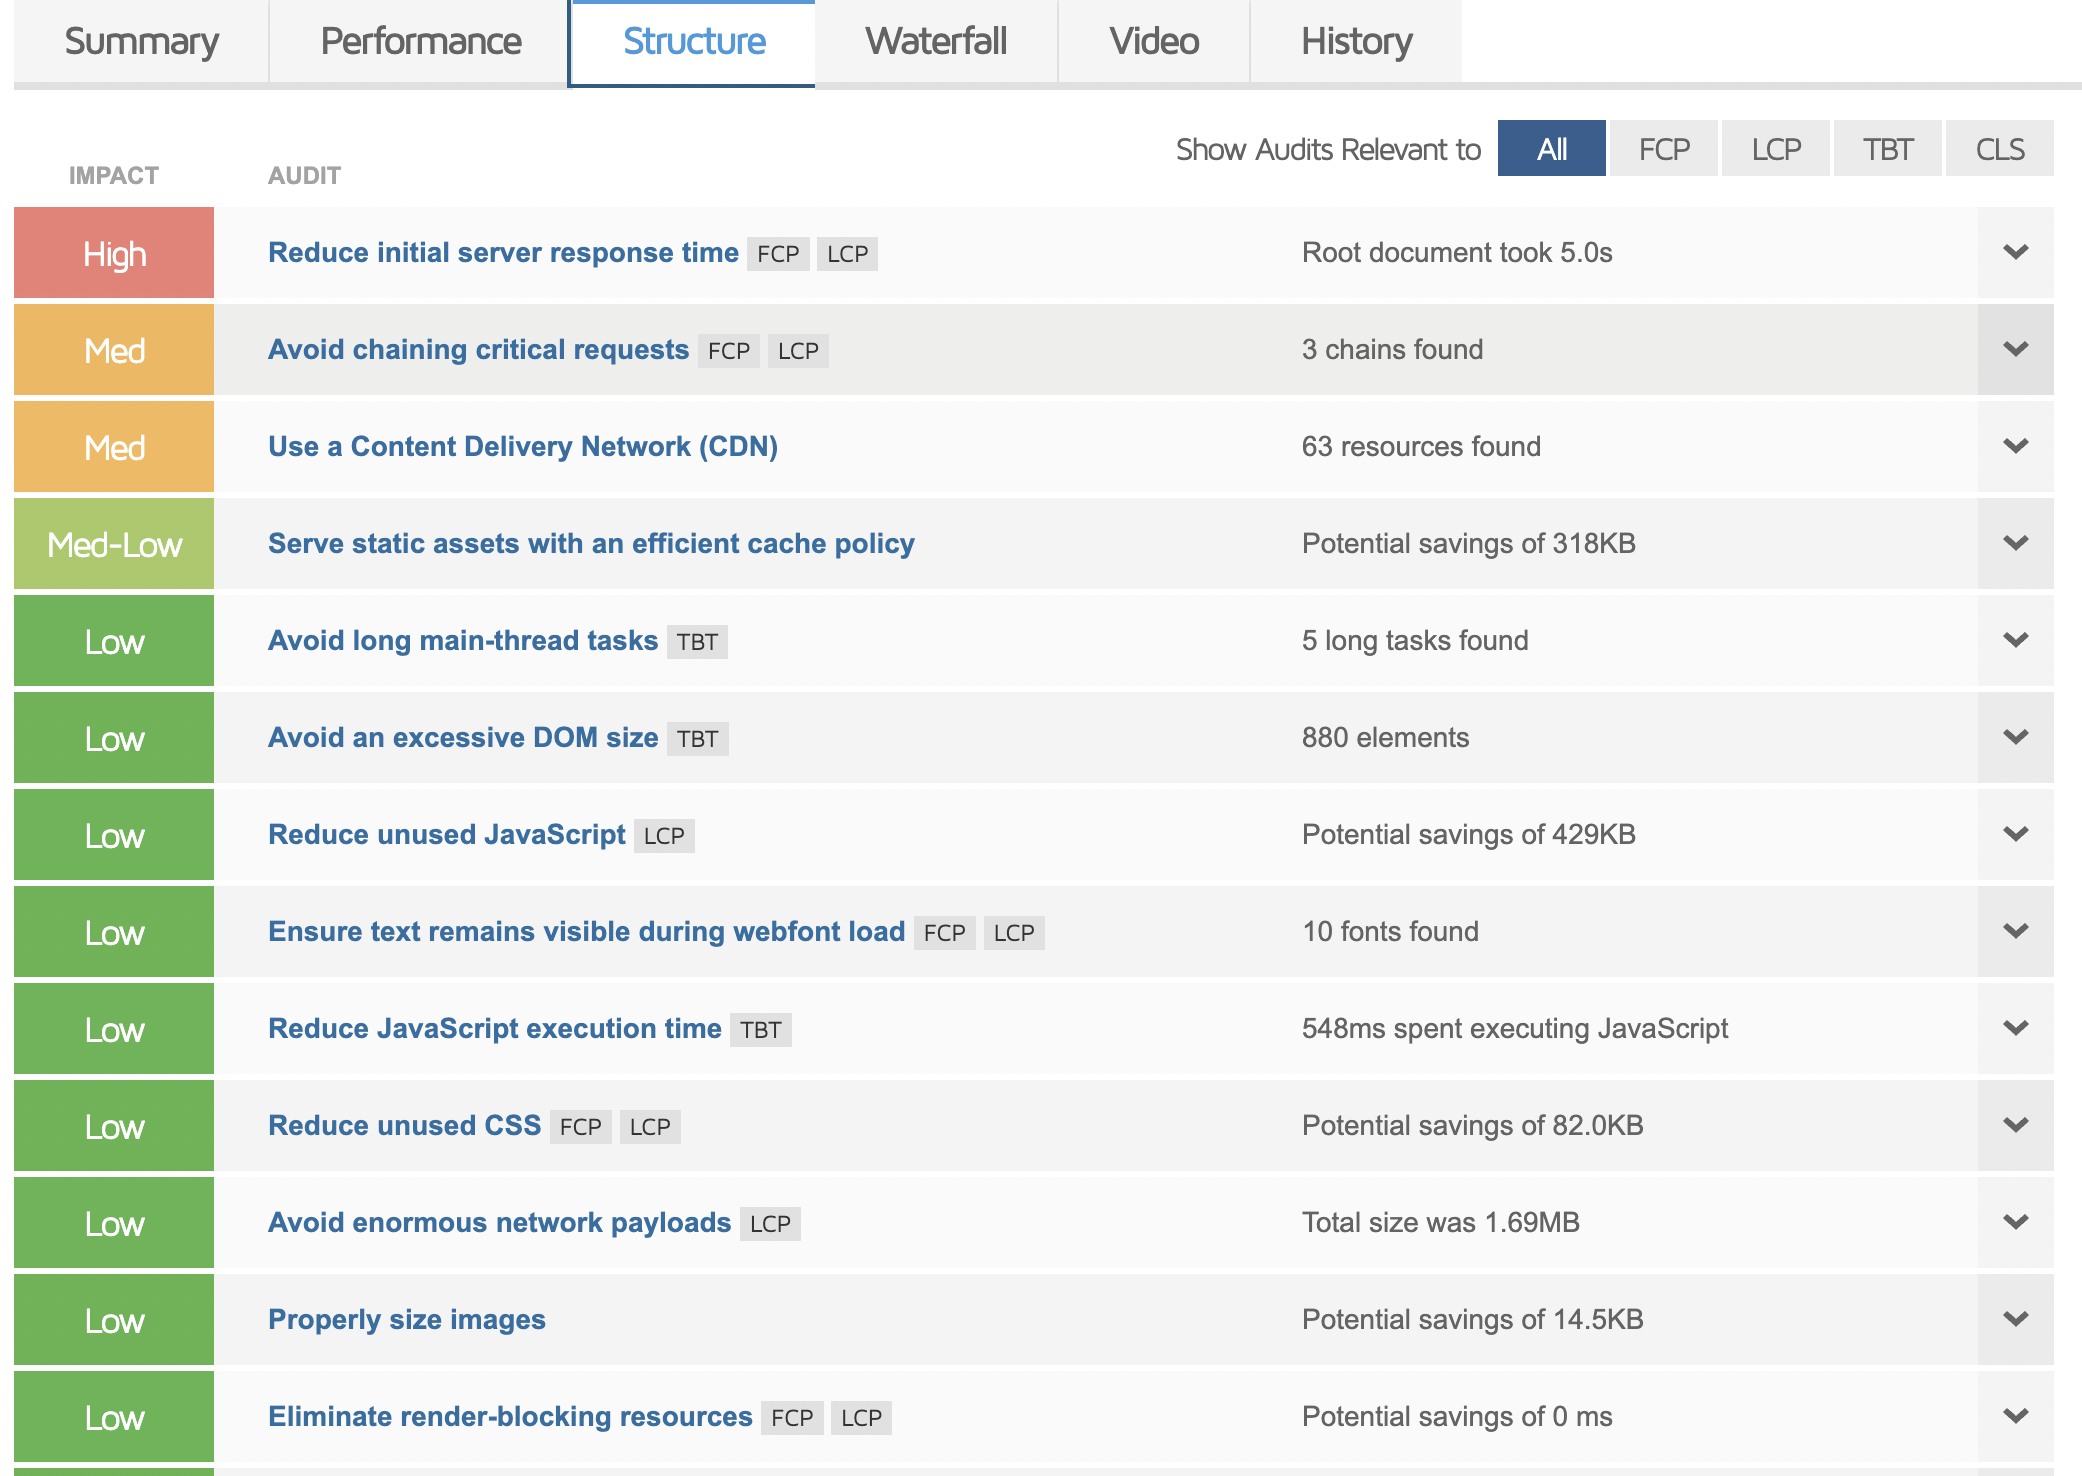
GTMetrix is an excellent audit tool for website page speeds that provides similar lab data as Google’s Lighthouse with even better visualization tools.
The Performance tab tells you everything you need to know about Core Web Vitals, and the Structure tab provides opportunities to improve page speeds.
 Screenshot from GTMetrix, March 2023
 Screenshot from GTMetrix, March 2023
However, my favorite tool on GTMetrix is the waterfall tab which allows you to visualize page load elements and how they influence page load times.
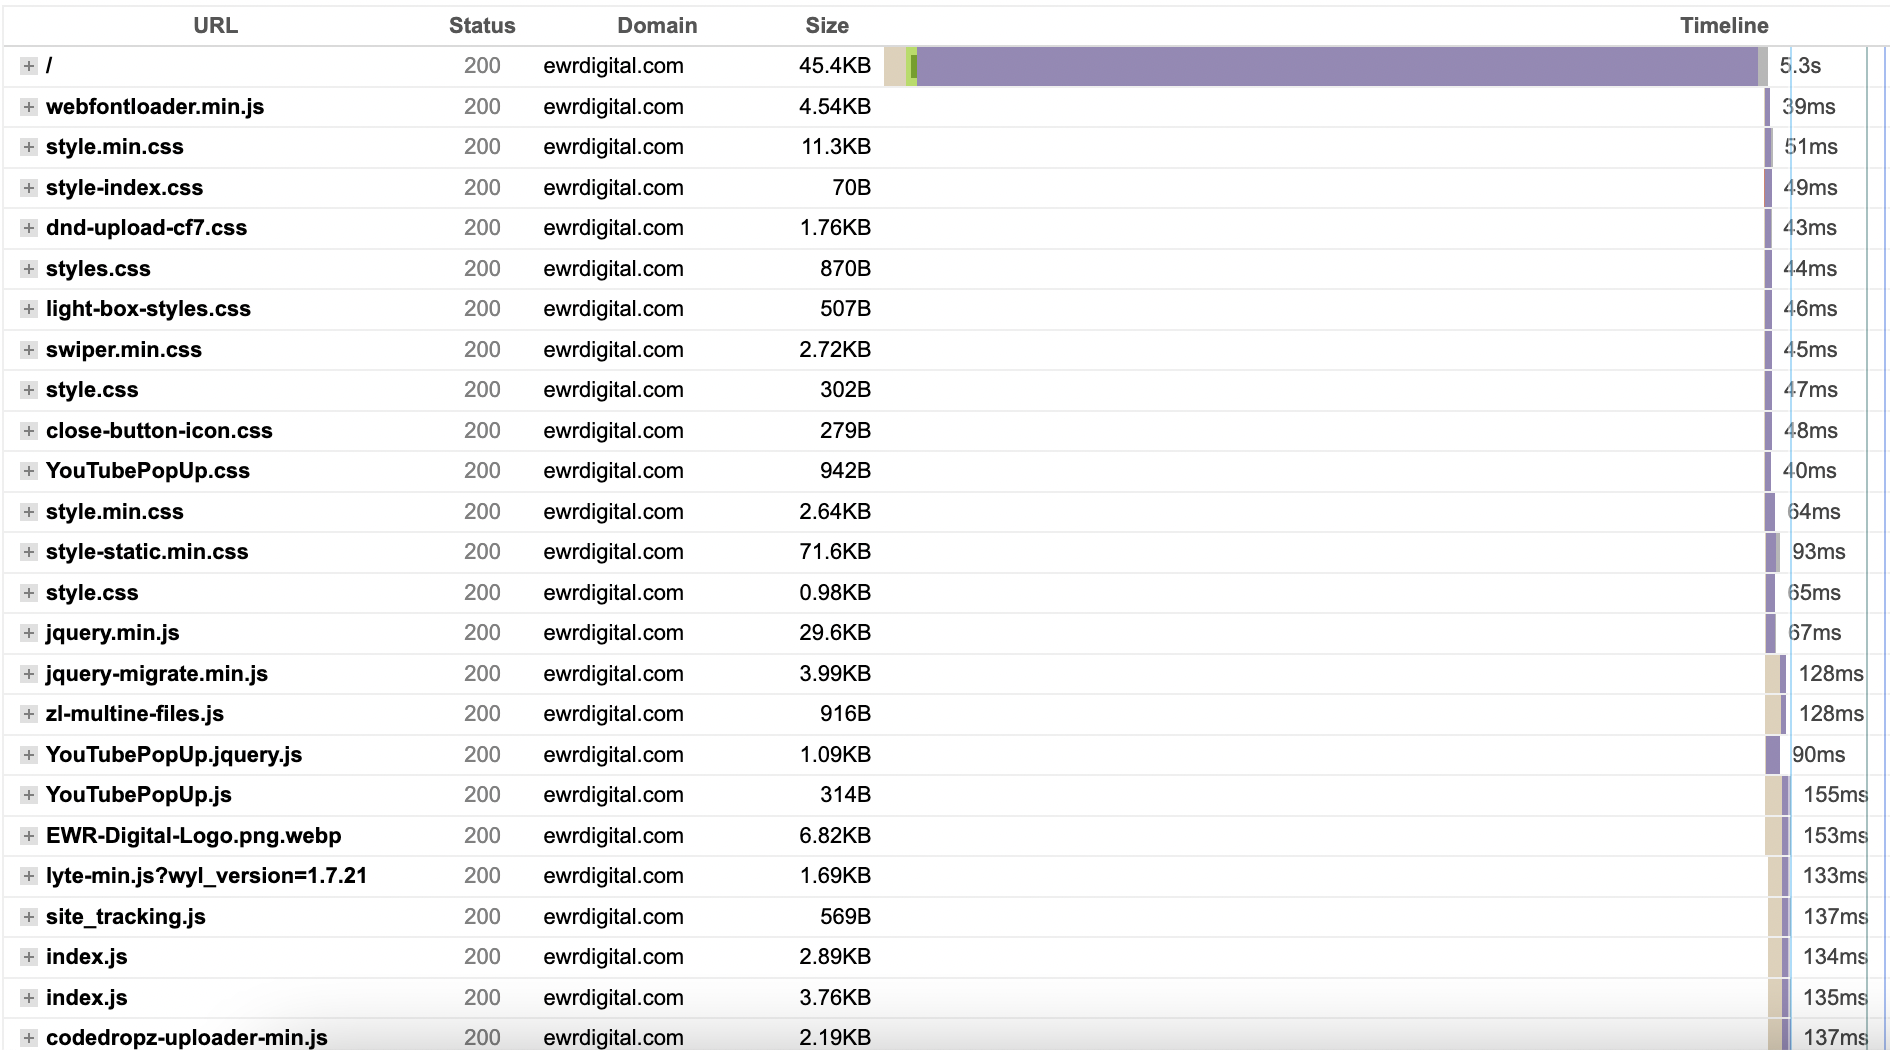 Screenshot from GTMetrix, March 2023
Pingdom
Pingdom is a paid tool, which is well worth the money if you need real-time page speed monitoring via its Real User Monitoring setting.
This tool allows both simulated lab data and real-time field data for you to see how your website performs over different devices, networks, and clients.
Pingdom also provides all the same metrics and actionable insights that other tools provide with ongoing support for your website.
WebPageTest
From my standpoint, WebPageTest is the best free speed test tool you’ve ever heard of.
This tool provides all of the same lab data as Lighthouse, with the ability to test on multiple devices and networks.
Some of its most notable features include:
- Waterfall.
- Video of your page loadout.
- Performance metrics.
- Trace views.
- Multiple tests at once.
Most importantly, you can see your website as it loads in real time with the Filmstrip View.
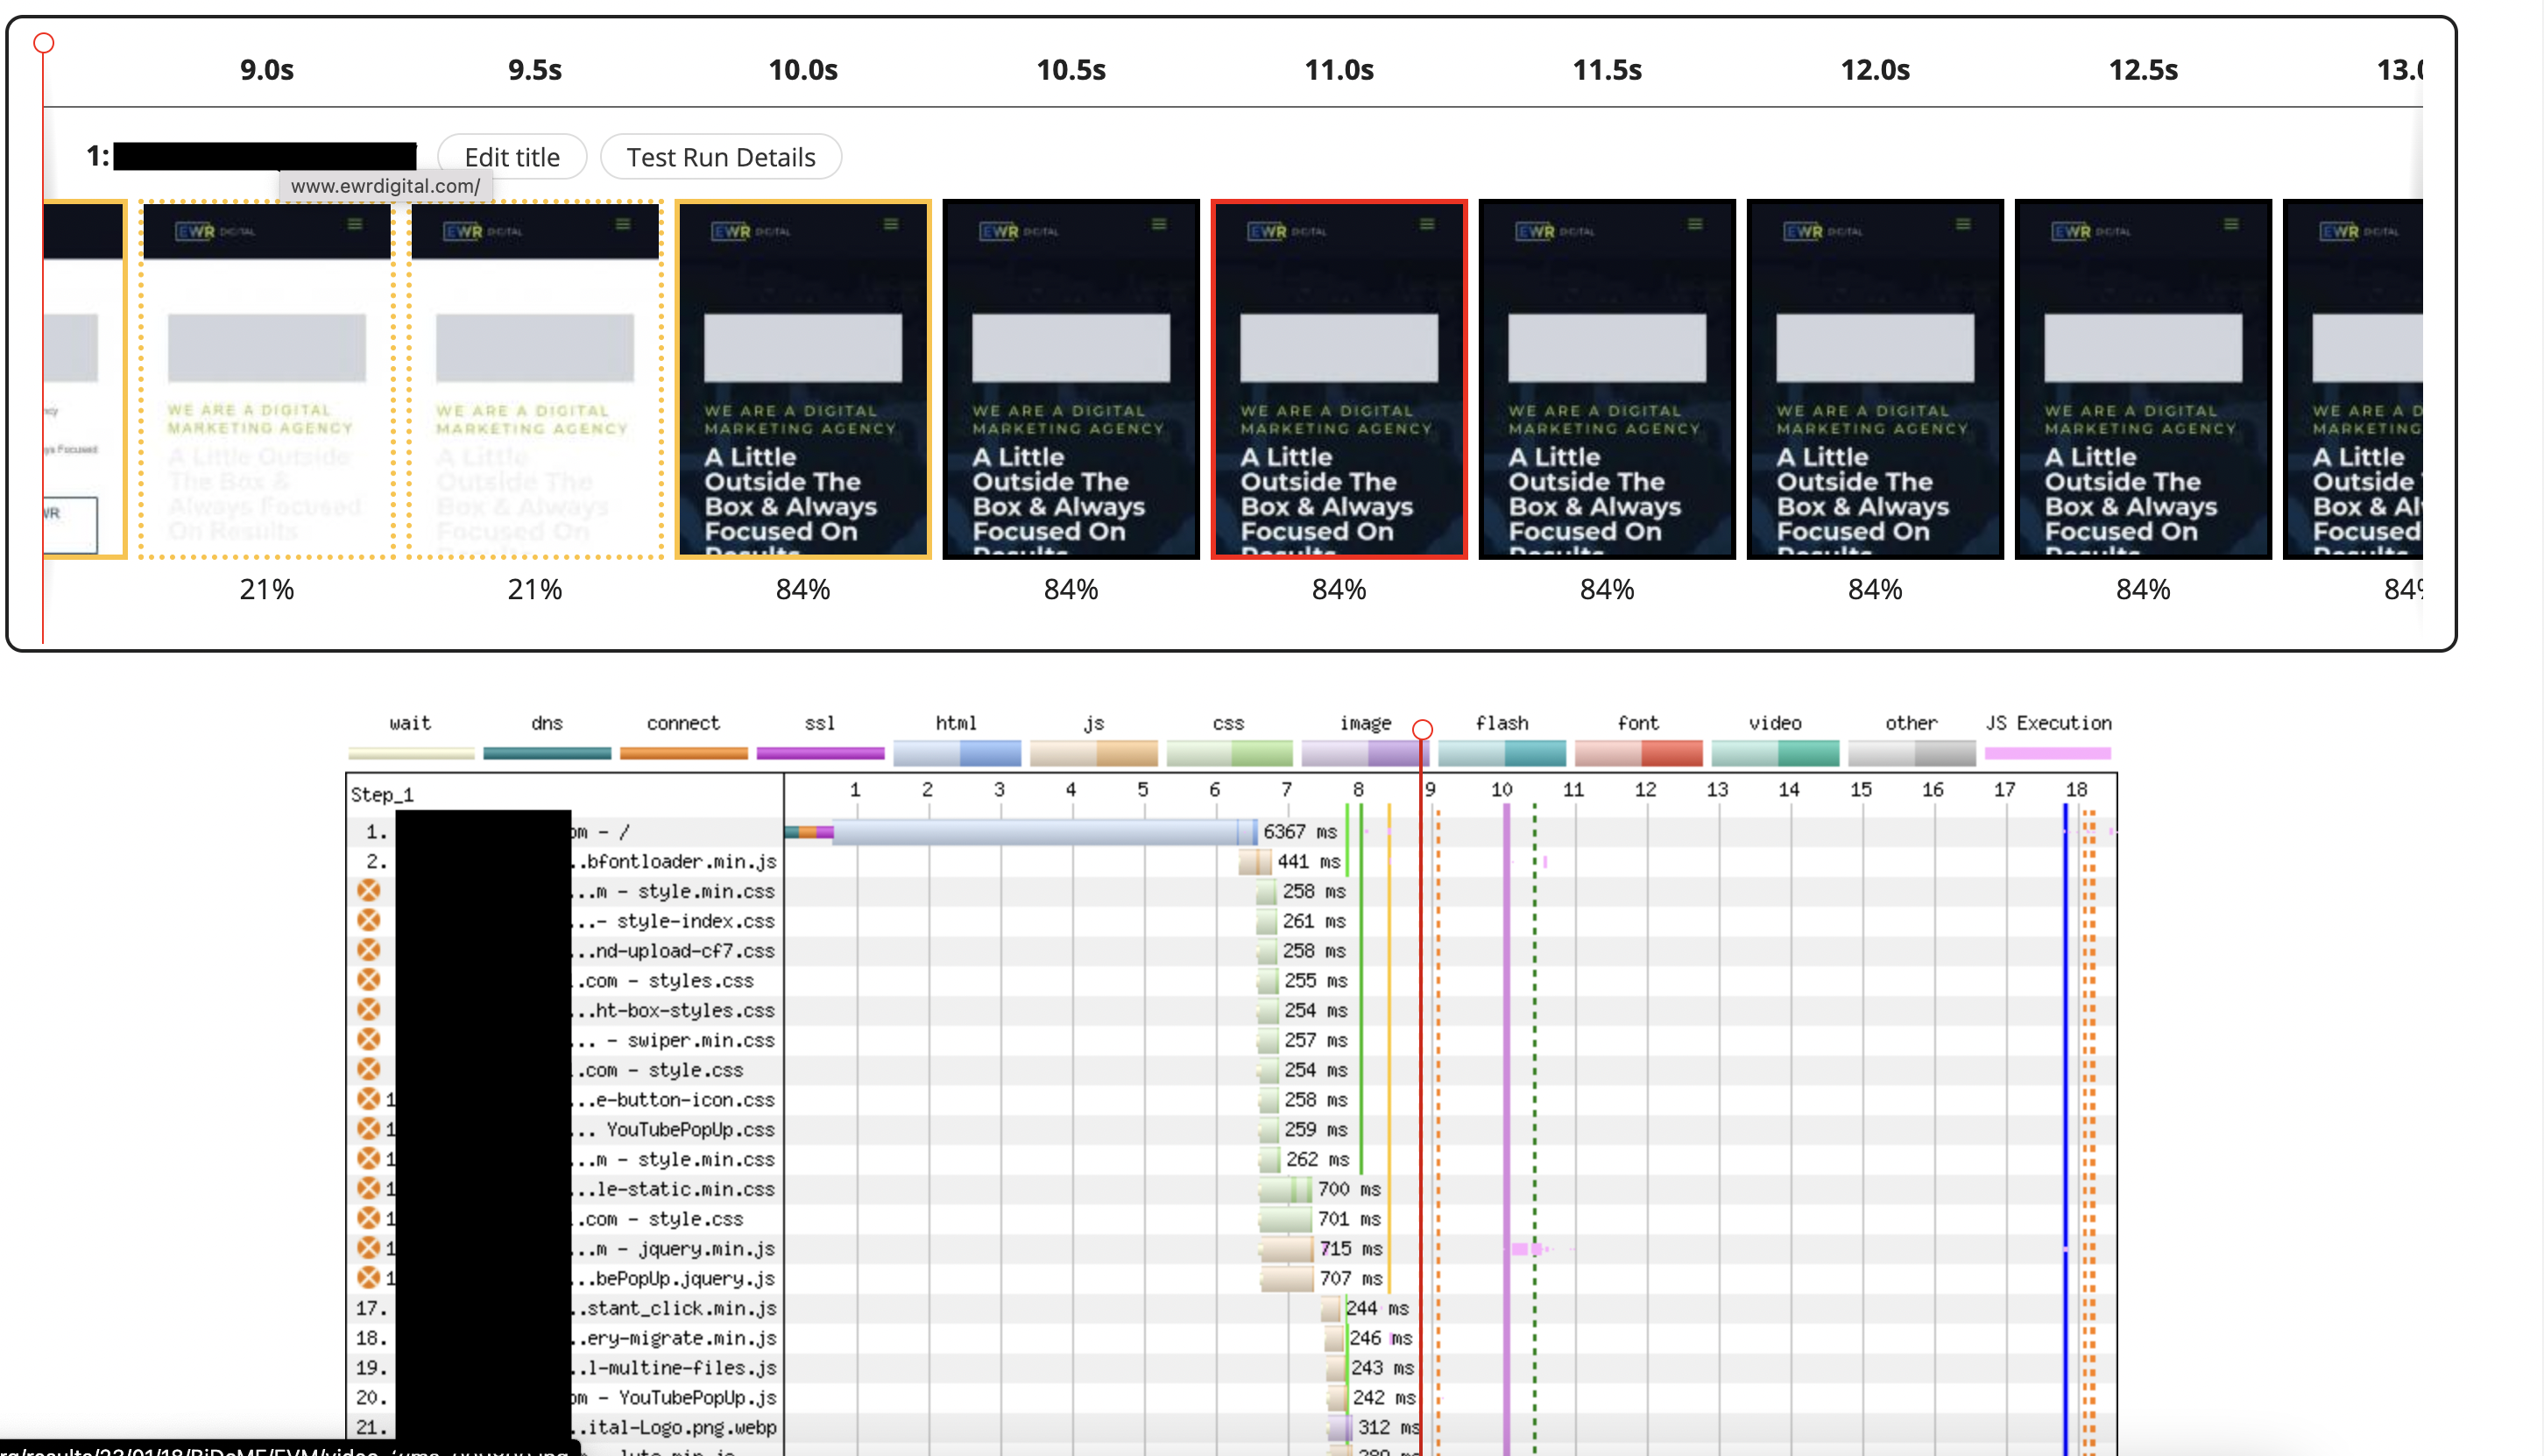 Screenshot from WebPageTest, March 2023
WebPageTest even provides a neat little questionnaire, such as whether your website is quick, usable, or resilient, with answers to tell you where your site needs improvement.
Google Search Console
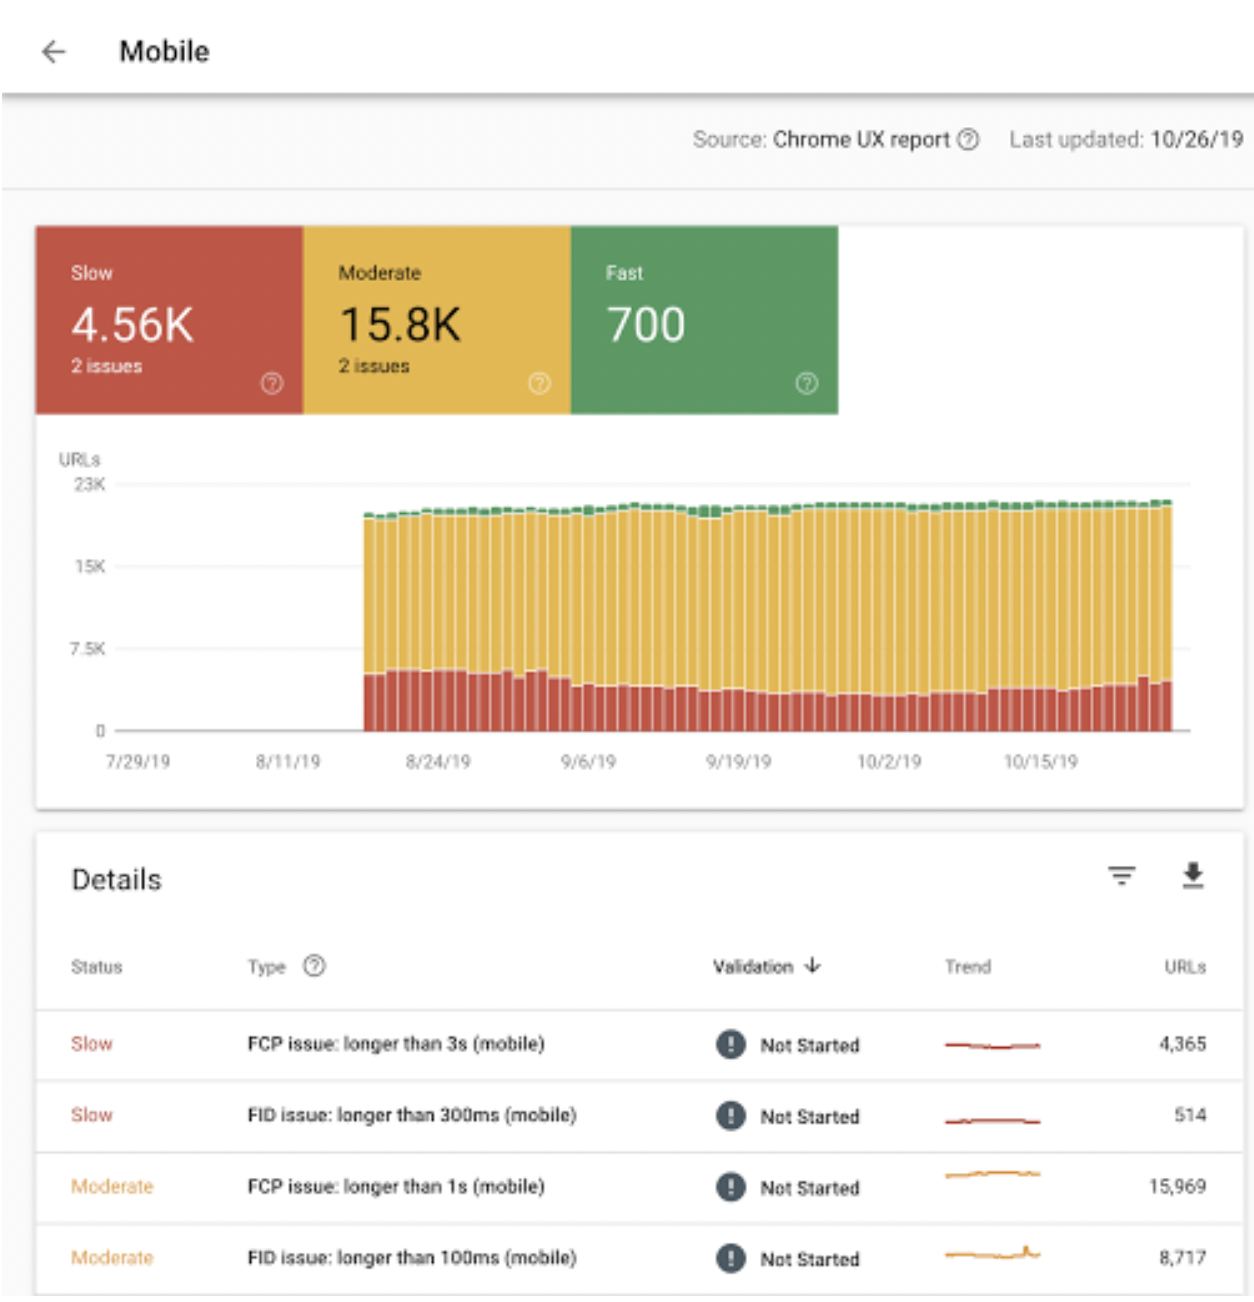
I highly recommend you access the Speed Report in Google Search Console for a more granular look at individual page speeds.
This report provides individual speed scores and overall performance across browsers and devices.
 Screenshot from developers.google.com, March 2023
Use Search Console to monitor any progress or changes to your site. Of course, you can also uncover a lot of the same data in Google Analytics.
New Relic
New Relic offers sophisticated tools to monitor page speeds over time, debug your code, and even clean up your plugins to channel faster site speed.
This tool requires a subscription, but it has useful features like alerting you when page speeds drop in real time after a change has been made to the site.
Tips To Improve Website Speed
While tools may point to individual issues with your website, there are some general best practices you can follow to improve your website page speeds.
Enable Compression
Large file and image sizes are a significant drag on any website, so enabling compression via an automated plugin can help.
There are dozens of plugins available for WordPress, including favorites like Optimole and WP Rocket that includes the Imagify plugin.
Caching
Caching is another easy win to boost website speeds rapidly for repeat customers.
Web or browser caching allows websites to store small bits of data on client-side devices, so fewer resources are fetched the next time they load a website.
Plugins like WP Rocket and WP Super Cache allow for caching and can significantly improve your user experience.
Lazy Loading
Another feature that caching tools like WP Rocket or LazyLoad offer is the ability to delay file loads until the user accesses them.
In other words, if you have images below the fold on a webpage, lazy loading allows a website to delay loading that image until a user scrolls down the page.
Optimize Your Server Location/CDN
Hosting your webpage on a geographically close server can significantly reduce latency and load times.
However, if you distribute content to a global audience, investing in a content delivery network (CDN) can greatly reduce latency times and load speeds for people worldwide.
Minify Resources
Besides images, CSS and JavaScript will be the two largest elements of any webpage that are required to load.
Therefore, minifying or eliminating unnecessary CSS and JavaScript resources, such as duplicate data, will reduce the number of requests and downloads a client and server must execute to load a page properly.
Reduce Plugins And Unnecessary Code
Finally, eliminating unnecessary resources, such as large backend plugins, will free up resources on your website and put less stress on devices as they try to load your website.
Unfortunately, it’s too common for WordPress site owners to leave behind legacy plugins long after they’ve served their purpose, which can greatly impact a website’s efficiency and functionality.
Conclusion
Now that you understand how to test your website speed and what metrics to look for, you can implement solutions to increase your website speed and monitor how they impact your SEO rankings.
While website speed is one of many factors, the benefits of a fast-loading website will significantly outweigh any of the costs you put into it.
More Resources:
Featured Image: Kaspars Grinvalds/Shutterstock
window.addEventListener( 'load2', function() { console.log('load_fin');
if( sopp != 'yes' && !window.ss_u ){
!function(f,b,e,v,n,t,s) {if(f.fbq)return;n=f.fbq=function(){n.callMethod? n.callMethod.apply(n,arguments):n.queue.push(arguments)}; if(!f._fbq)f._fbq=n;n.push=n;n.loaded=!0;n.version='2.0'; n.queue=[];t=b.createElement(e);t.async=!0; t.src=v;s=b.getElementsByTagName(e)[0]; s.parentNode.insertBefore(t,s)}(window,document,'script', 'https://connect.facebook.net/en_US/fbevents.js');
if( typeof sopp !== "undefined" && sopp === 'yes' ){ fbq('dataProcessingOptions', ['LDU'], 1, 1000); }else{ fbq('dataProcessingOptions', []); }
fbq('init', '1321385257908563');
fbq('track', 'PageView');
fbq('trackSingle', '1321385257908563', 'ViewContent', { content_name: 'how-to-test-your-website-speed', content_category: 'seo' }); } });

