Beyond page visits, users interact with the content on our website in different ways.
Understanding user interactions in detail is essential to draw conclusions, make improvements, and refine strategies for a digital strategy approach.
This content performance and user engagement analysis is possible through GA4.
Analyzing Content Performance With GA4
Landing Pages Report
Site owners can monitor how users interact with their content and pages through the Landing Page report.
Specifically, the performance of these pages can be analyzed individually via the section Reports > Engagement > Landing Page.
This section shows the first page that visitors land on within the site and the number of visitors to these pages.
On this report, site owners can filter by individual URLs or group them according to URL taxonomy, allowing for the analysis of key metrics, such as the number of sessions, average session duration, and the most relevant events for these pages.
In addition, when analyzing the pages, we can include filters to analyze the results of each individual page in more detail.
For example, by including the “Page path and screen class” dimension, you can study the user’s journey within the website.
Some Engagement Metrics To Know
In this section, site owners can use metrics to study how users interact with their content beyond analyzing visitors and sessions.
This can be done through average engagement time per session or through events.
Getting To Know User Engagement
To effectively measure user engagement on a site via GA4, it is important to understand what events are, how to set them up, and how to analyze data through Path Exploration Reports.
Events And Key Events
Events are metrics used in GA4 to track specific user interactions on a website, such as page loads, link clicks, or form submissions.
Key events (previously known as conversions) are the most important events that site owners want to highlight.
Path Exploration Reports
Path exploration reports allow you to analyze the different pages visited by users on a website, the path they took, and how they interacted with those pages.
There are several predefined path exploration reports, but users can also create their own using GA4 metrics.
For example, going back to the previous example (Landing Page Report), we can go beyond the individual analysis of pages.
Through Path Exploration reports, it is also possible to analyze what a user did before or after visiting a page or screen in a sequential manner:
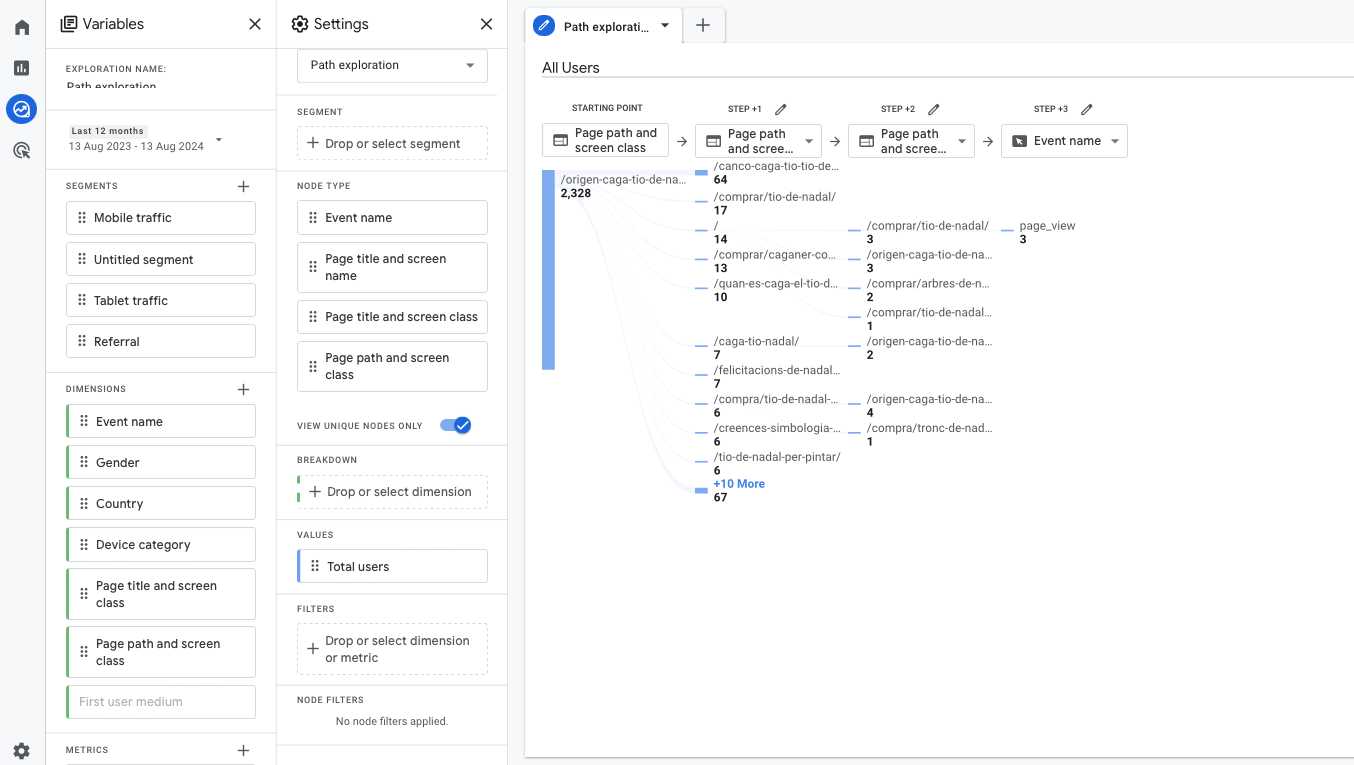 Screenshot from GA4: Example path exploration report. Node: ‘Page title and screen class.’
Monitoring User Interactions
Interaction Rates With Key Elements
Thanks to events, we can monitor user interactions on our website.
To do this, it’s important to understand that there are four types of event measurement in GA4:
- Automatically collected events: GA4 collects these events by default, such as first visits or session starts.
- Enhanced measurement events: When enhanced measurement is enabled, these events are tracked automatically. This category includes interactions like form submissions, file downloads, and video plays.
- Recommended events: GA4 suggests certain events that are not tracked automatically but are recommended based on the sector or website goals. You can implement these events manually with predefined names and parameters, often through Google Tag Manager. Examples include user interactions during a product purchase process (add to cart, begin checkout, purchase), when a user logs into a website, or when a lead is generated.
- Custom events: Beyond the default and recommended events, site owners can create custom events to track relevant interactions on their website, such as clicks on specific buttons (e.g., phone or email).
For instance, user reviews can be monitored via custom events using tags created through Google Tag Manager on buttons.
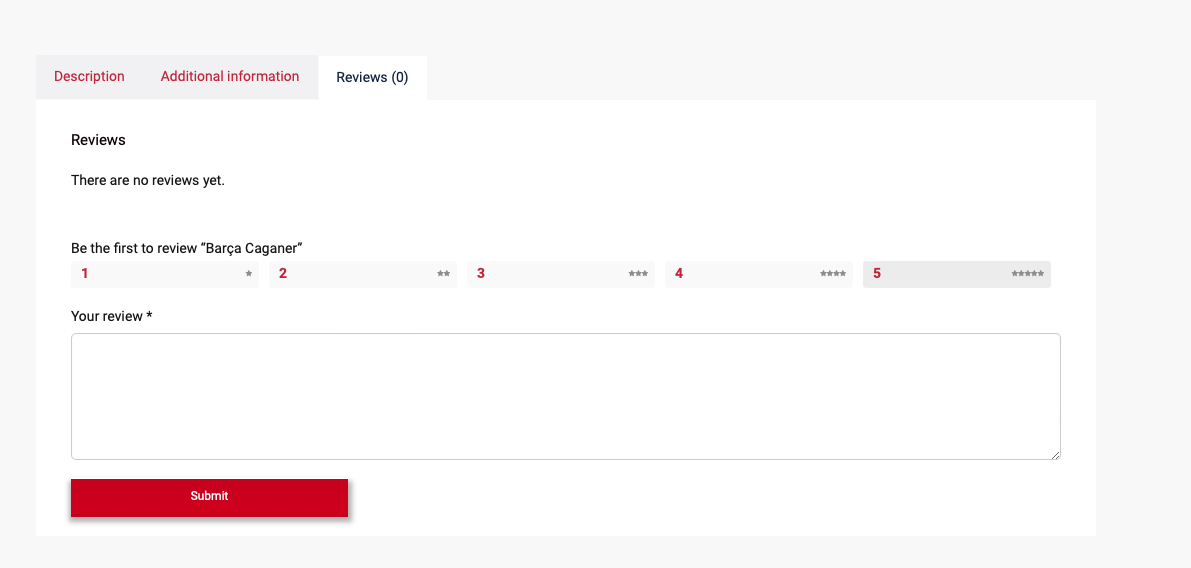
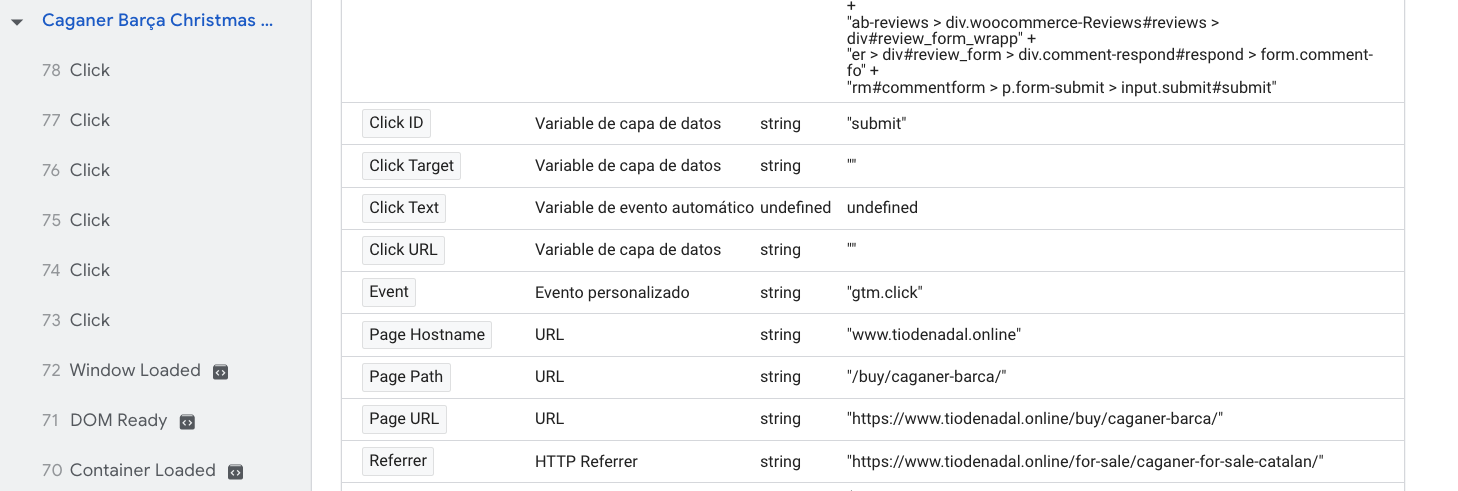 Screenshot from Google Tag Manager: Click text button “Submit.”
Through events, we can also examine which types of reviews users click to view for each product.
In the following example, the site owner could create events using the “Click text” variable based on the review score or simply analyze the total number of reviews.
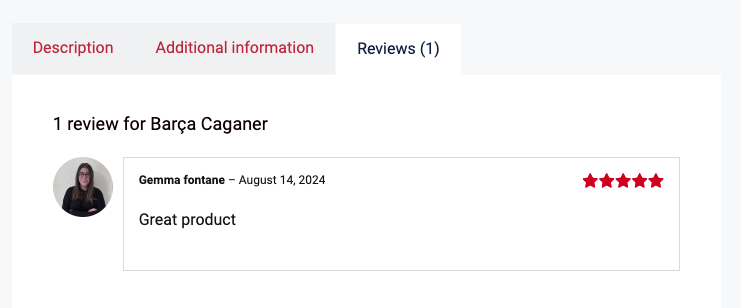
 Screenshot from Google Tag Manager: Click text “Rated 5 out of 5.”
To analyze the clicks that happen on review scores in GA4 reports, you need to create a custom event with the conditional name “review_click” and pass “Click Text” as a custom dimension “review_rating_score” via Google Tag Manager. Read this guide on how to set up custom events.
Once implemented, we can view the performance of these events through the Events section within GA4:
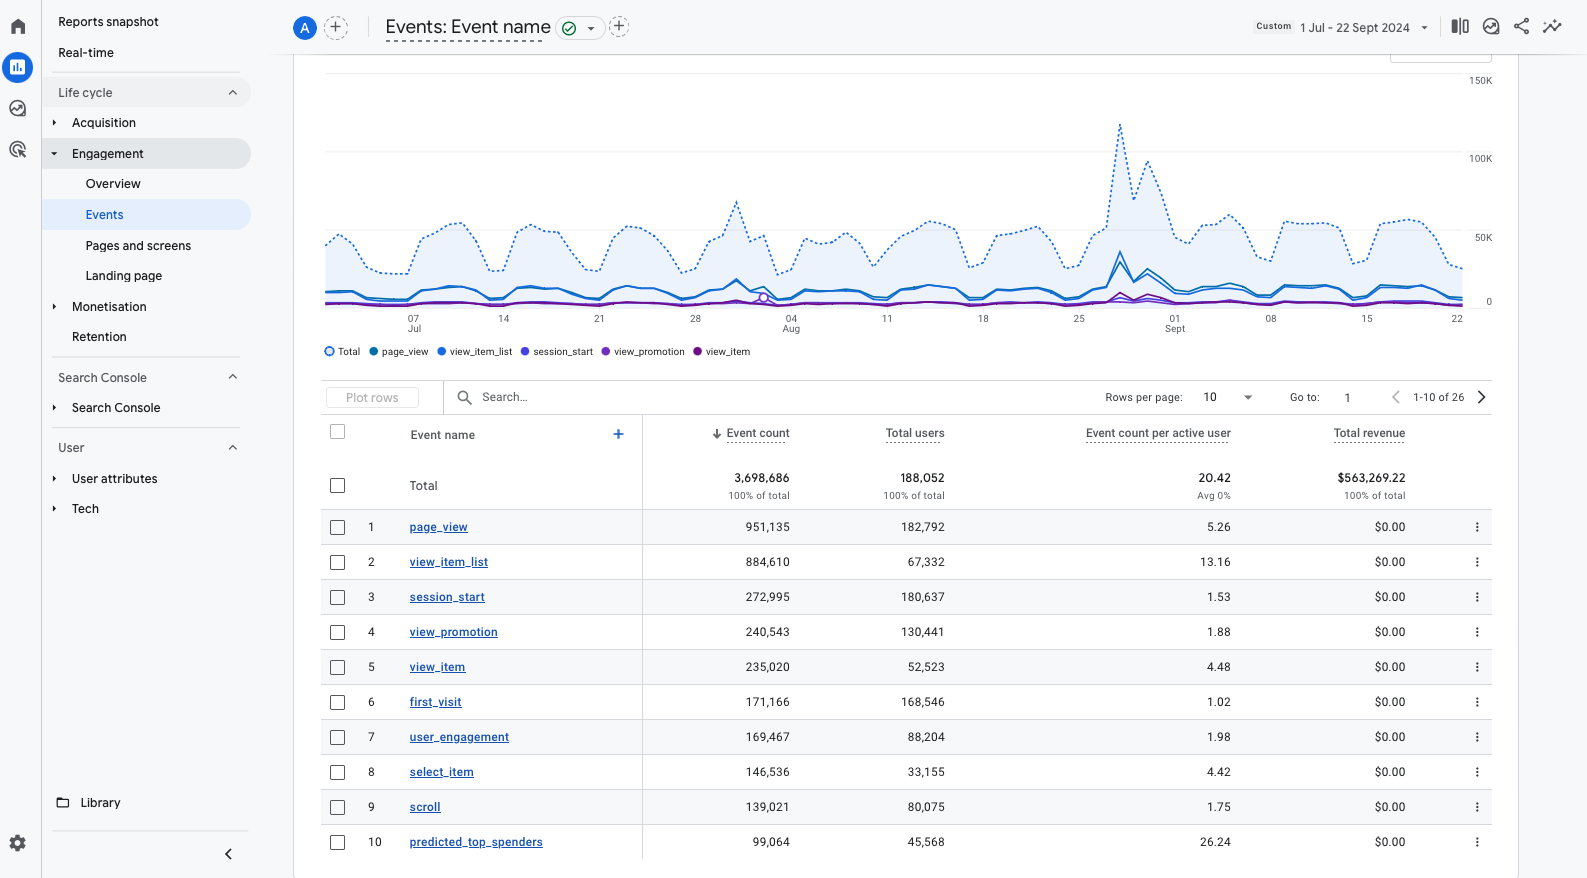 Screenshot from GA4, September 2024
Evaluating Content Success
Content Grouping In GA4
Content grouping through GA4 helps site owners analyze different types of content on a website, whether in different formats or page types.
For this, it is important to have the content formats or topics well-identified and classified in advance (author page, article, infographic, video, etc.).
For example, if we want to analyze how users interact with a group of article pages with different topics, you need to send to GA4 the built-in parameter “content_group” either via Google tag or GTM.
If your website architecture is hierarchical (e.g., ‘/cars/sedan/bmw/’), you may use {{Page Path}} variable to set it in Google Tag Manager.
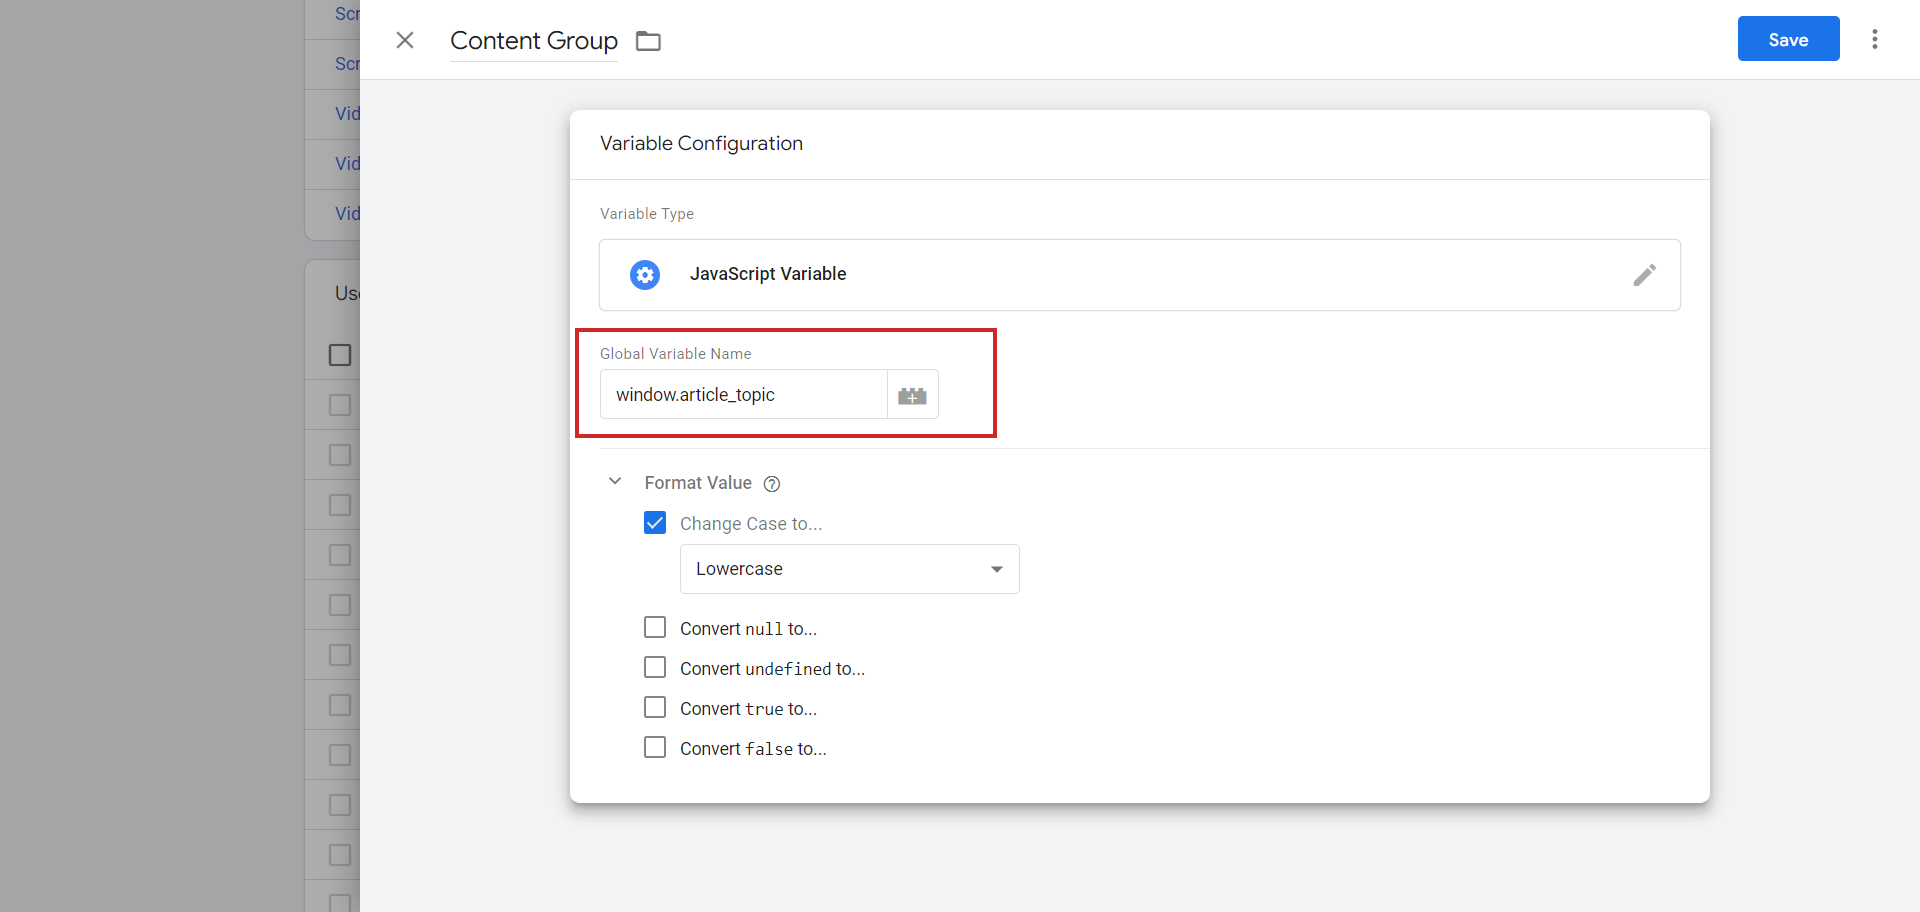
However, if your website has flat architecture, you will not be able to do so. In that case, you may need to do a little coding to pass via global JS variable article topic information from your CMS to GTM.
Say you were able to set a variable in your CMS:
window.article_topic="sedan"In GTM, you can get that value and assign it to the ‘content_group’ variable in the tag configuration.
You can see how articles with different topics perform via Reports > Engagement > Pages and screens or Landing Pages and choosing content_group from the top.
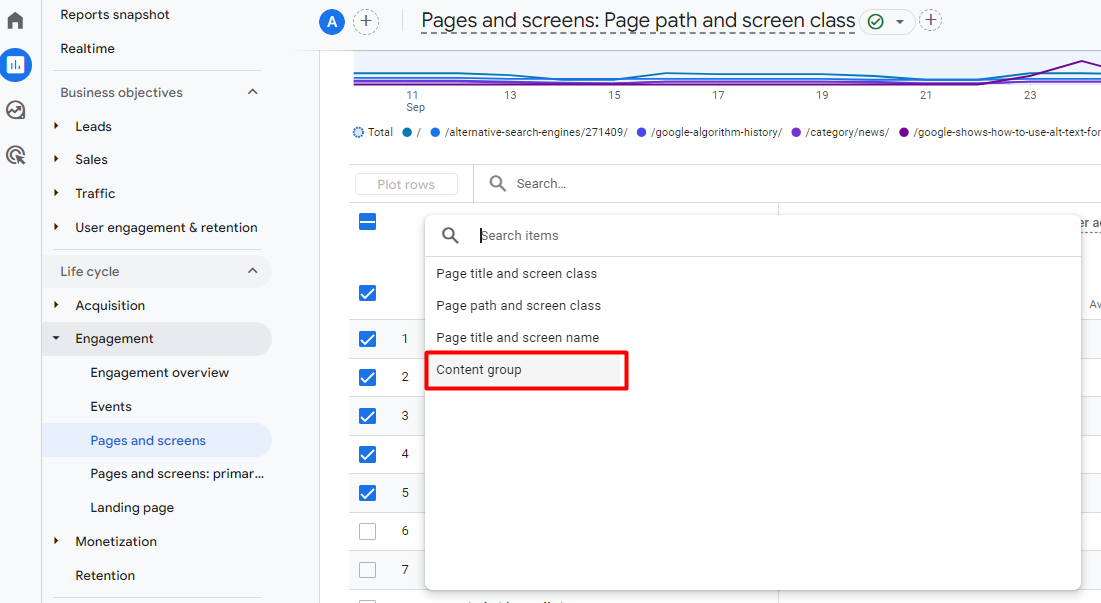 How to choose content_group as dimensions
And analyze aggregate traffic coming directly to these topics and how users interact with them.
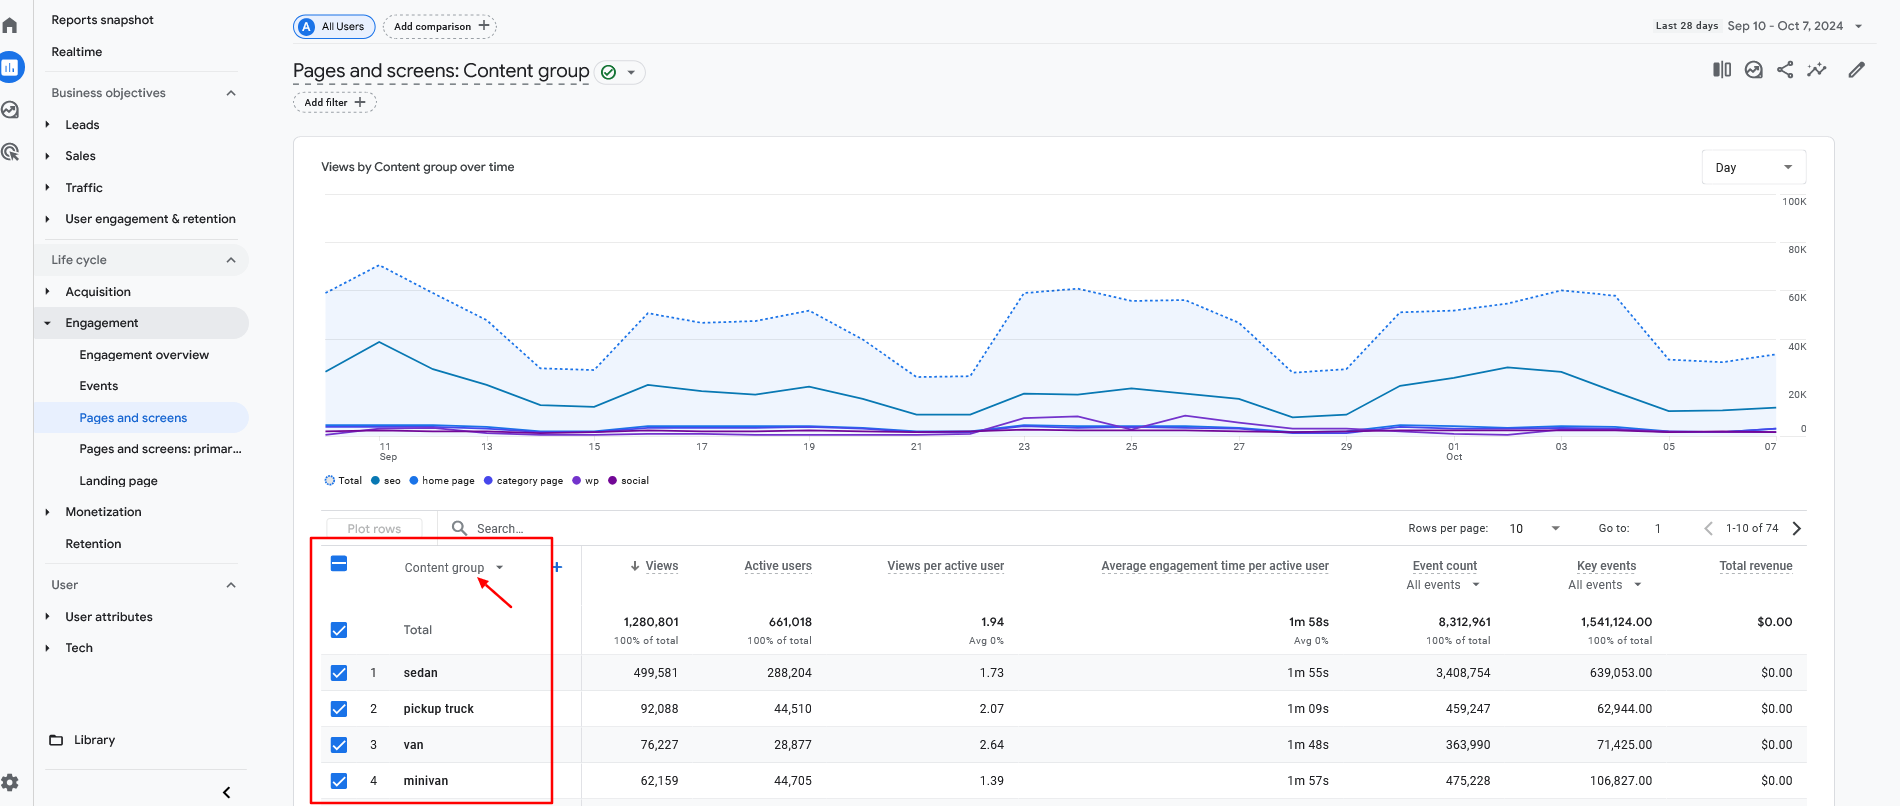 GA4 report with content_group as a dimension
Additionally, as we demonstrated earlier in this article, using a path exploration report, we can further analyze user interactions on the website.
Analyze Content Authority Via GA4
Authoritativeness refers to the extent to which the content creator or website is recognized as a reliable source for the topic.
By becoming a leading company in the market, a site can strengthen its brand authority. There are several ways to monitor this authority via GA4.
Monitor Traffic From Relevant Sites
To analyze traffic coming from other websites, navigate to Reports > Acquisition > Traffic Acquisition > Referral.
To focus on the most relevant sites for your business, you can apply specific filters, such as those targeting .com or country-code-level domains that are a priority for your business.
If you need to add filters to include or exclude specific sites, you can customize the GA4 reports accordingly.

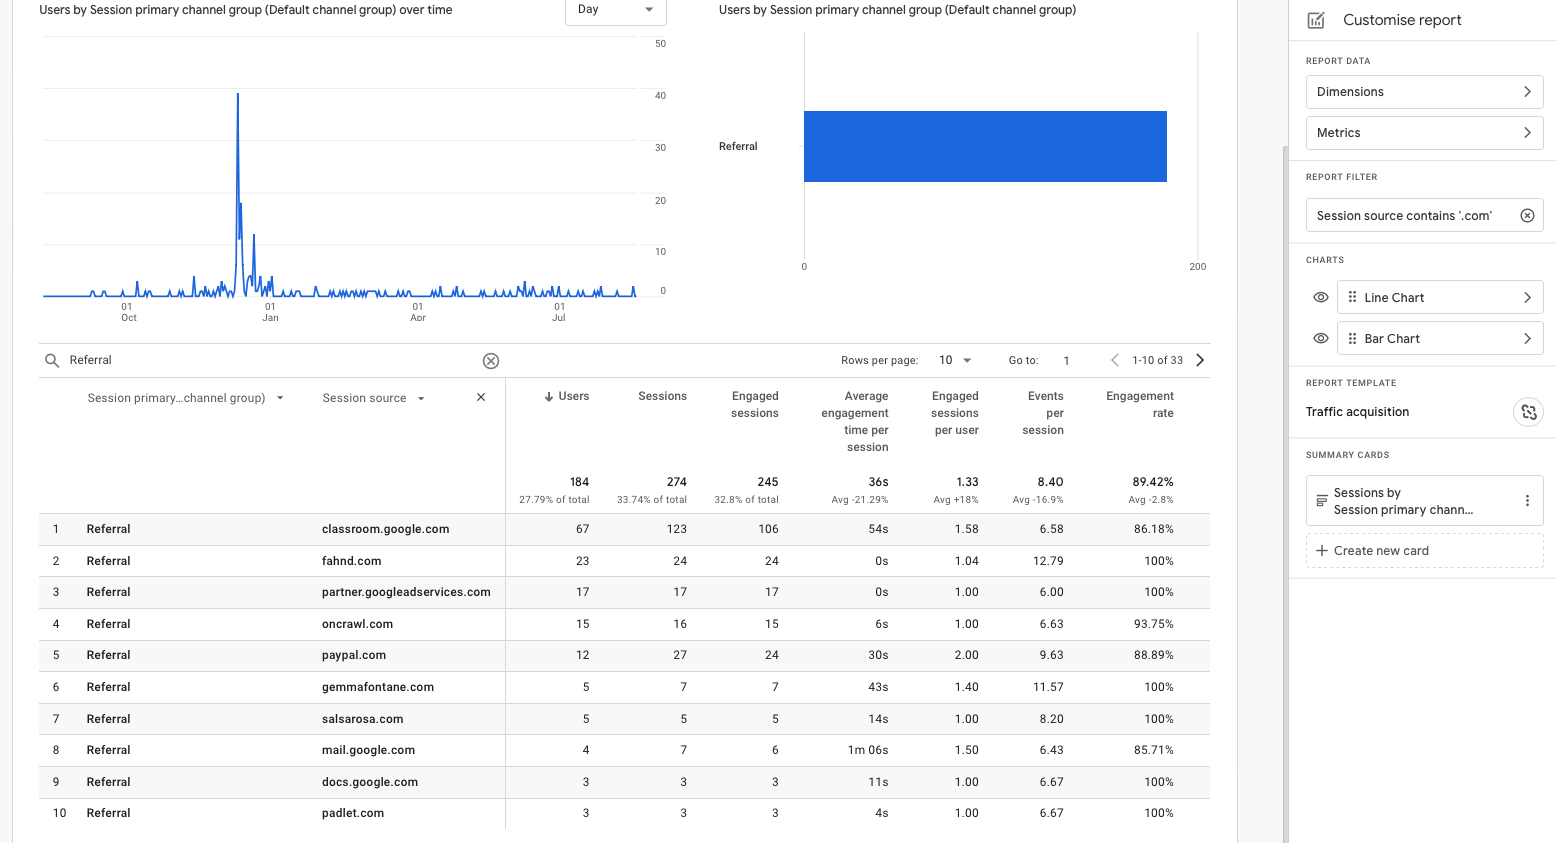 Screenshots from GA4: Customized Report. Filter: Session source contains ‘.com’
Other options for analyzing referral traffic with different filters include using Looker Studio, Google Sheets, or similar tools for data analysis and visualization.
In these cases, it is advisable, whenever possible, to incorporate UTMs into the links on these external websites. This will allow for a more detailed analysis of the traffic.
Monitor Brand Traffic
Monitoring how brand traffic evolves can help analyze brand authority – it even allows for analysis by country or time period, and more.
To analyze brand traffic, it is important first to link Google Search Console with GA4.
Next, go to Reports > Search Console > Queries, where you can see the number of organic Google Search clicks from a query.
In this report, by filtering for the brand name of the site, it is possible to view the total volume of organic clicks, as well as the impressions, CTR, and average position of queries related to the brand.
Additionally, we can filter by country or compare with previous periods to observe temporal changes over time:
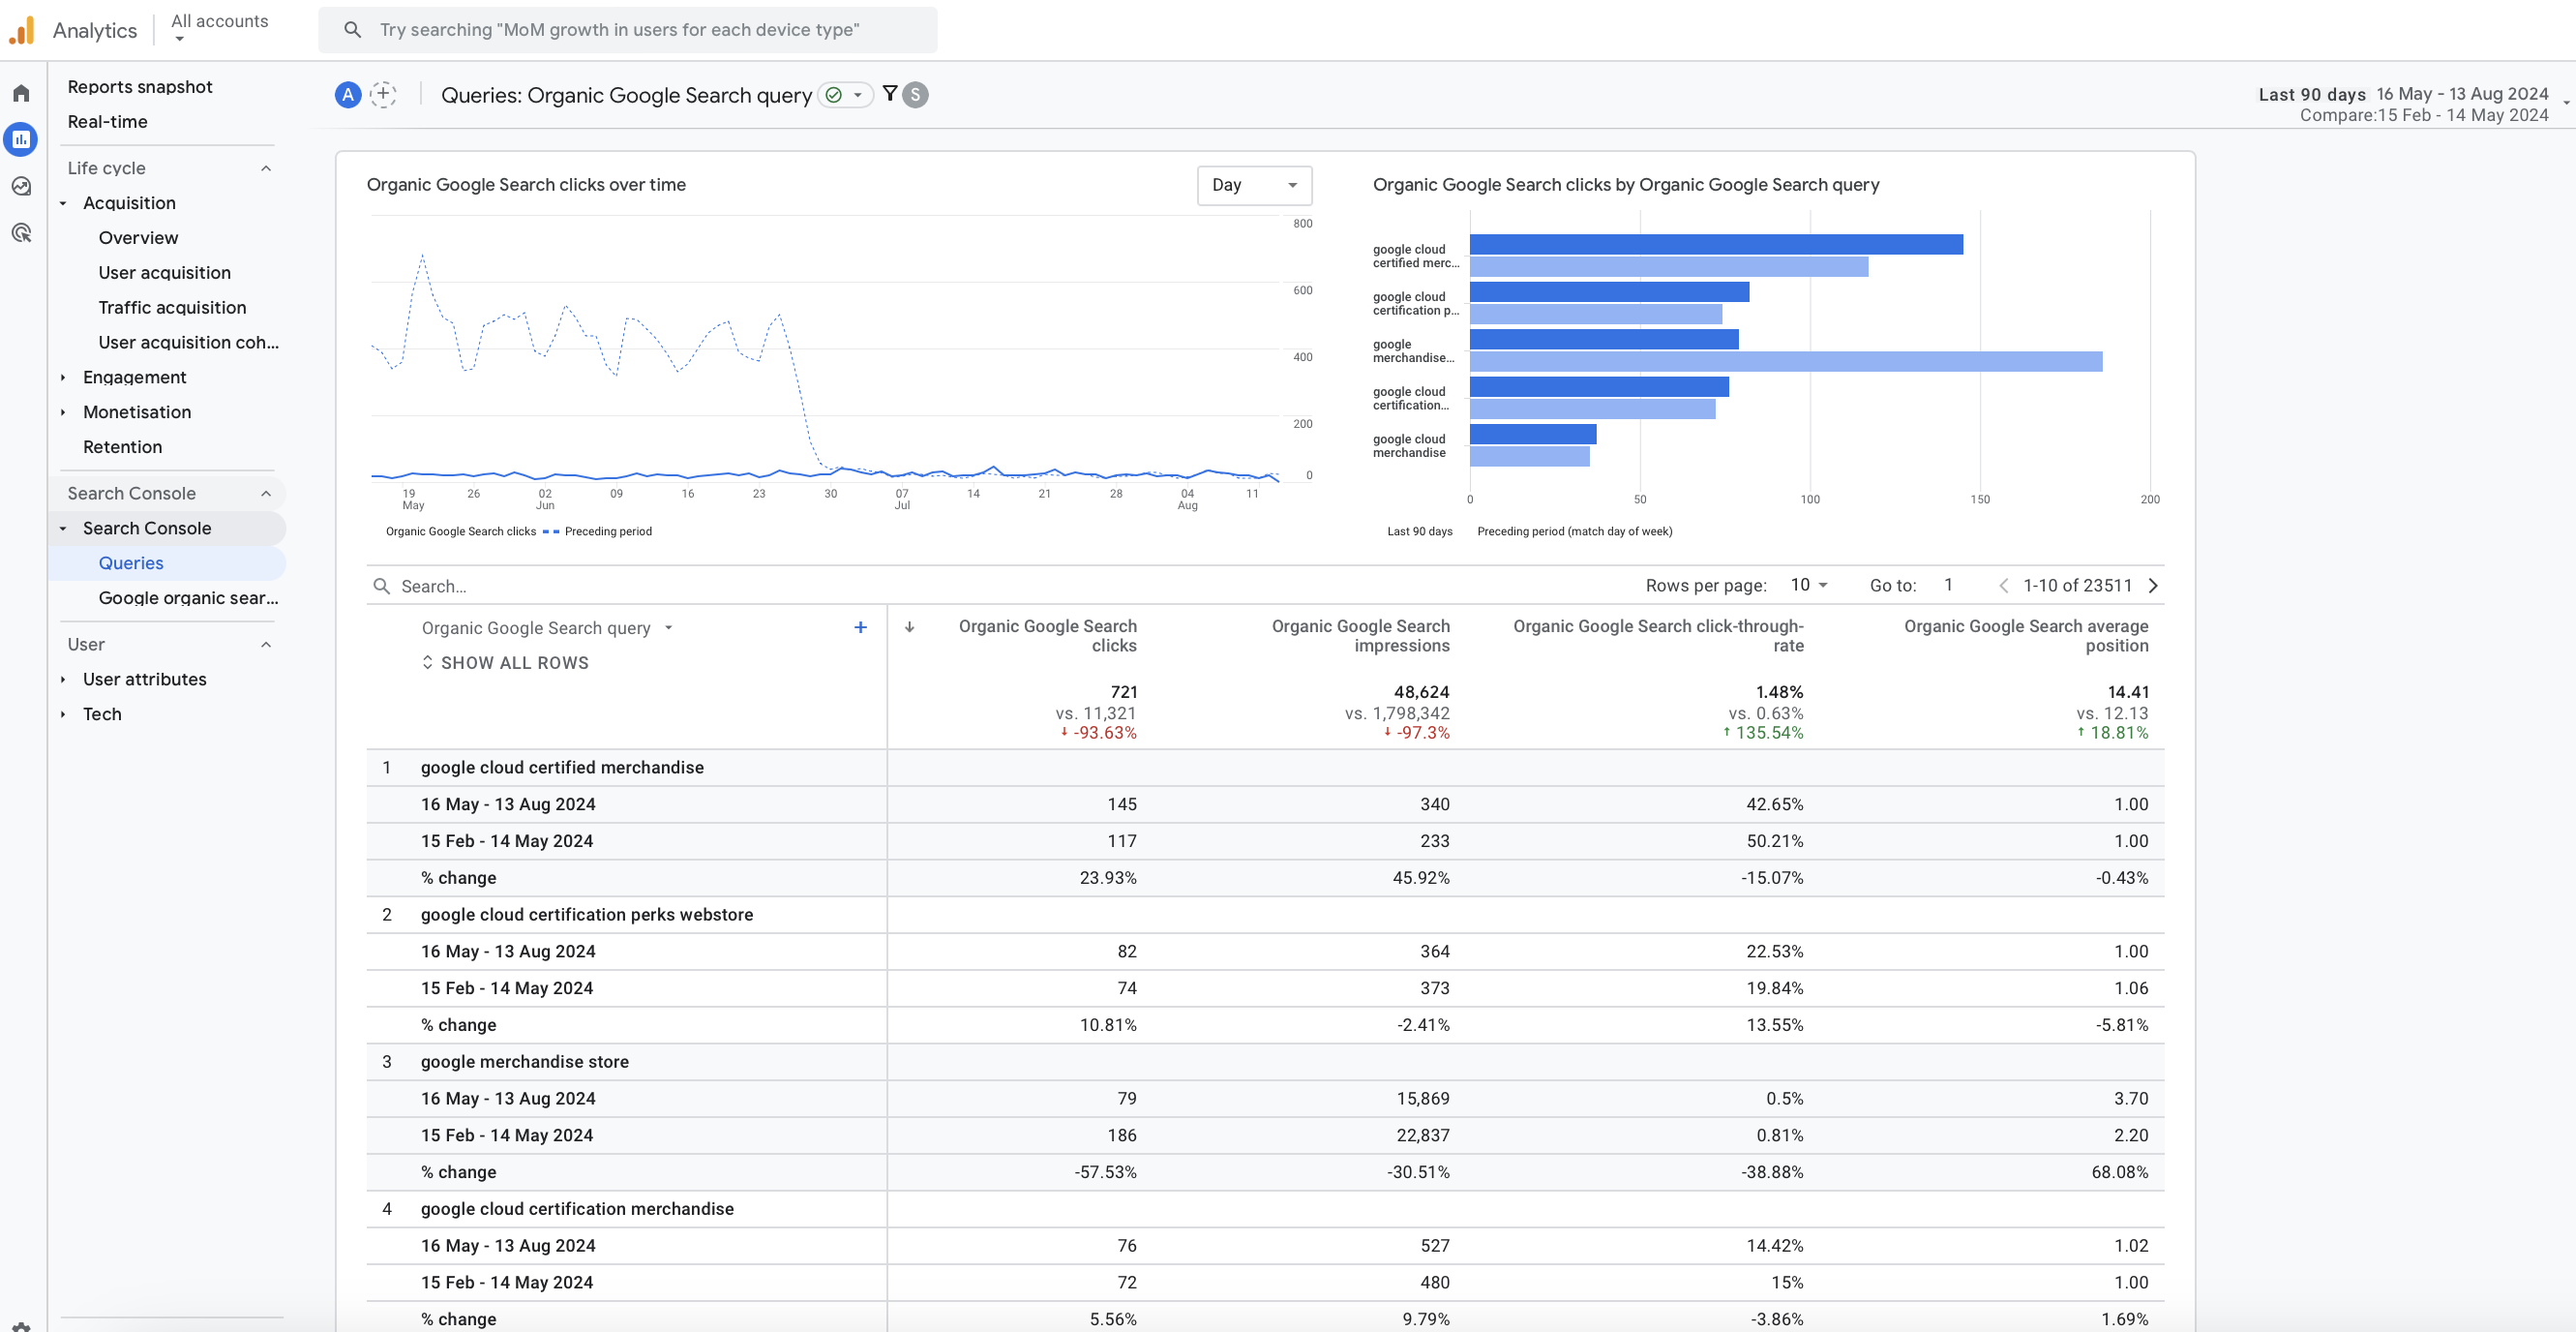 Screenshot from GA4: Website Brand Name Analysis – Last 6 Months
This allows for the analysis of how the brand authority of a website evolves and how users interact with it.
Reporting To Optimize Content Strategy
Analyzing user engagement and content performance in detail is key to drawing meaningful conclusions and making informed improvements to digital strategies.
With GA4’s reports, events, and path exploration, website owners can gain a better understanding of how users interact with their content, helping them refine their strategies effectively.
The most important thing is to identify the content to be analyzed and determine the best way to do so, ensuring it can be visualized optimally and efficiently based on the objectives.
Beyond the default reports provided by GA4, users can also create custom reports.
Comparative Analysis
If we want to analyze different segments or audience groups with common characteristics, we can do so through comparative analysis within each GA4 panel.

 Screenshots from GA4, October 2024
Custom Reports
As mentioned earlier, for a more detailed analysis of user interactions, we can use Path Exploration Reports, such as analyzing user interactions during a product purchase process on the site.
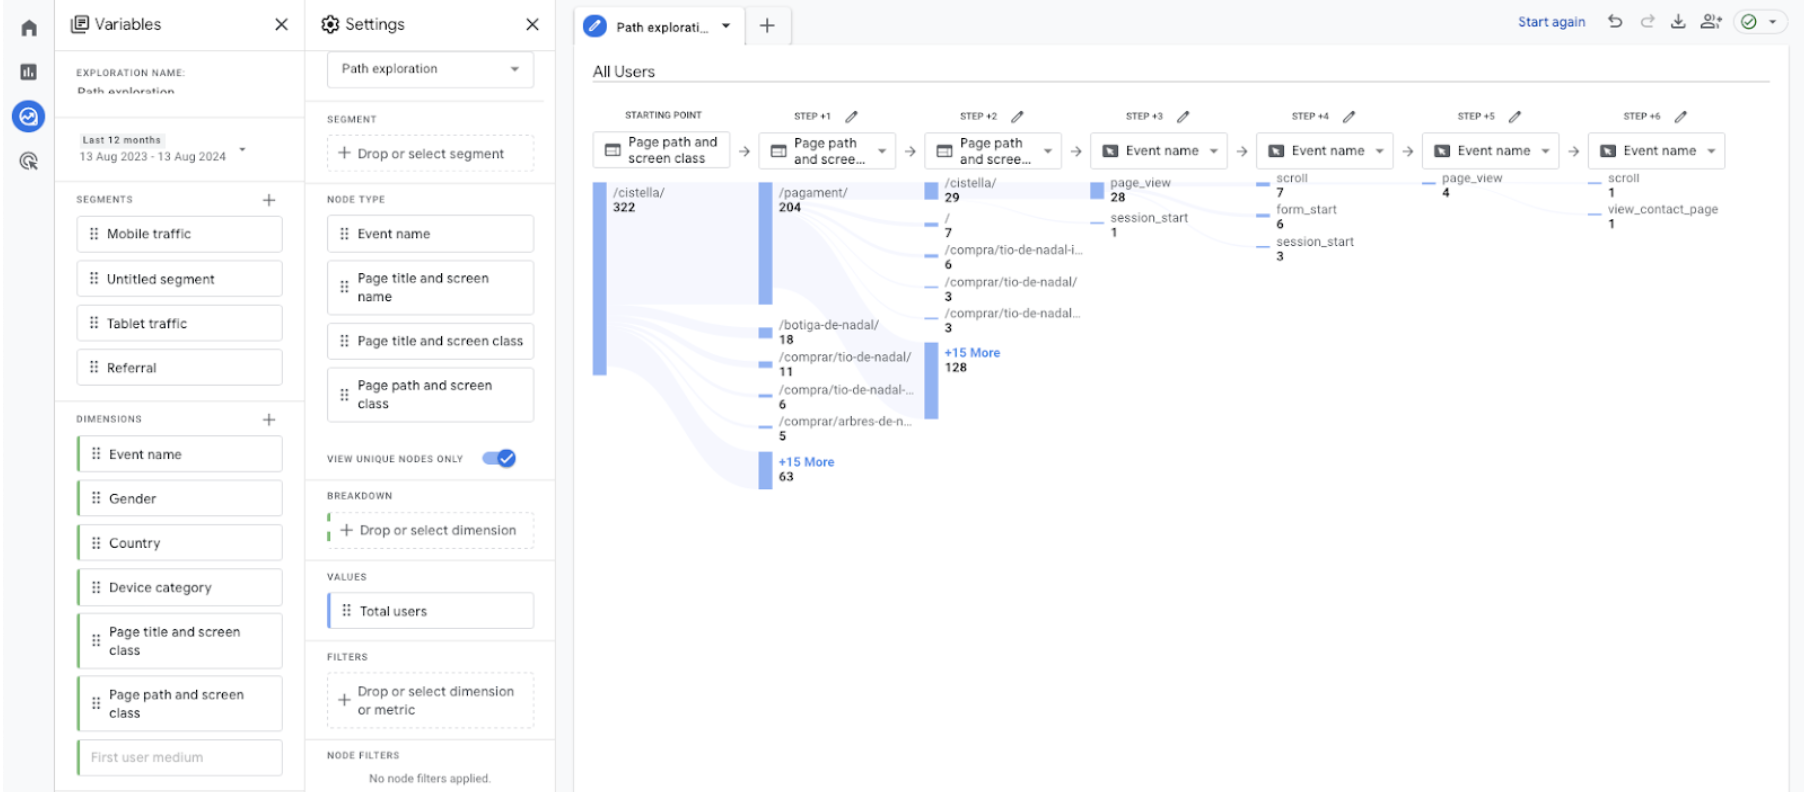 Screenshots from GA4, October 2024
Looker Studio
Beyond analyzing user interactions with content via GA4, site owners also have the option to create custom reports with Looker Studio, incorporating all the relevant metrics.
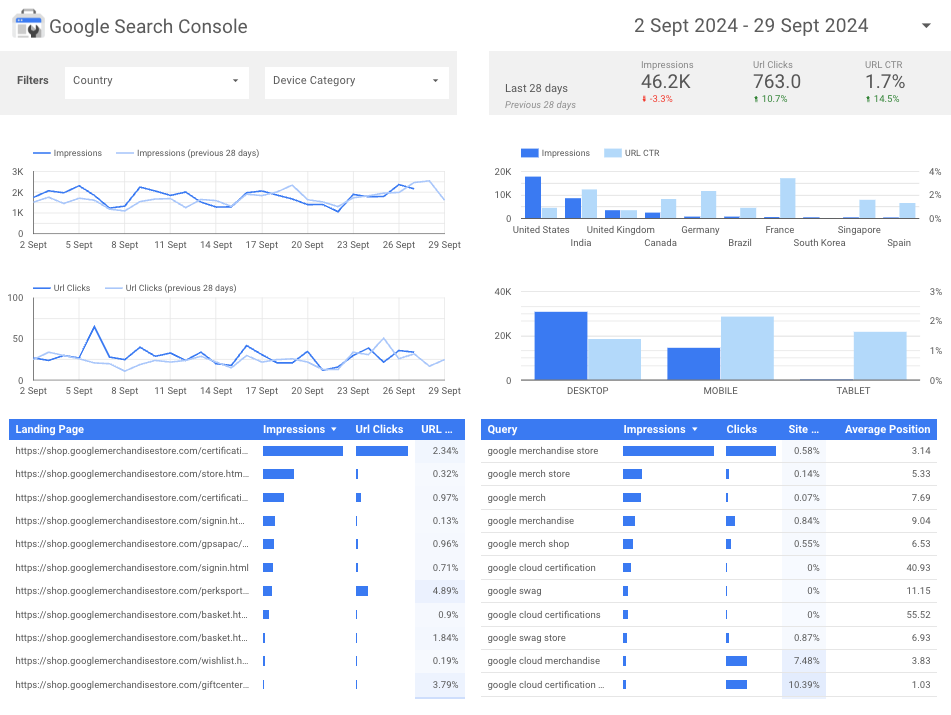 Google Search Console report predefinded via Looker Studio
Analyzing user engagement and content performance with GA4 enables website owners to draw meaningful conclusions and optimize their digital strategies effectively.
Content Performance Analysis: Meaningful Conclusions
Basic data like views only tells you so much. With some customization, GA4 can tell you a lot about how users actually respond to the content on your website.
Use this information to identify high-performance content and low-performance content.
Compare the different content types, topics, and specific factors on the page to improve your processes and results. This is a user-centric perspective that will help you communicate better with your audience and build more effective pages.
More resources:
Featured Image: N Universe/Shutterstock

